
What is social media analysis?
Let’s start with a definition.
Social media analysis is the study of data related to a brand’s activities on social network sites like Facebook, Instagram, and Twitter.
The goal of doing a social media analysis is to:
- Find insights that can improve your social media marketing strategy
- Understand how your current social media strategy is performing in comparison to your competitors
What is social media analysis not?
This might sound like a strange one, why do we need to say what it is not? There are many interpretations of analysis is. Some people think that by looking at their Google Analytics dashboard that they are doing analysis.
It isn’t.
Social media analysis is not copying data from an analytics platform and pasting it into an Excel sheet. Nor is it creating a chart from that Excel data and pasting it into a Powerpoint document and sending it to your boss or client.
That’s social media reporting. Telling someone what has happened. It’s conveying information to someone else.
Many social media managers will compare the performance of various metrics against their competitors to see where they stand. Simply performing this action is called social media benchmarking. It’s an essential part of a social media strategy and vital when it comes to reporting, but it’s not an analysis.
Social media analysis is about asking why the metrics are the way they are. It’s about digging deeper. The metrics you see are a symptom of what a brand has done. A social media analyst’s job is to find out what the brand did, why it had that impact, and glean insights that can help create a better social media strategy.
How to do social media analysis?
Consider the chart below. It shows the fan growth of five fast-food restaurants in the United States.
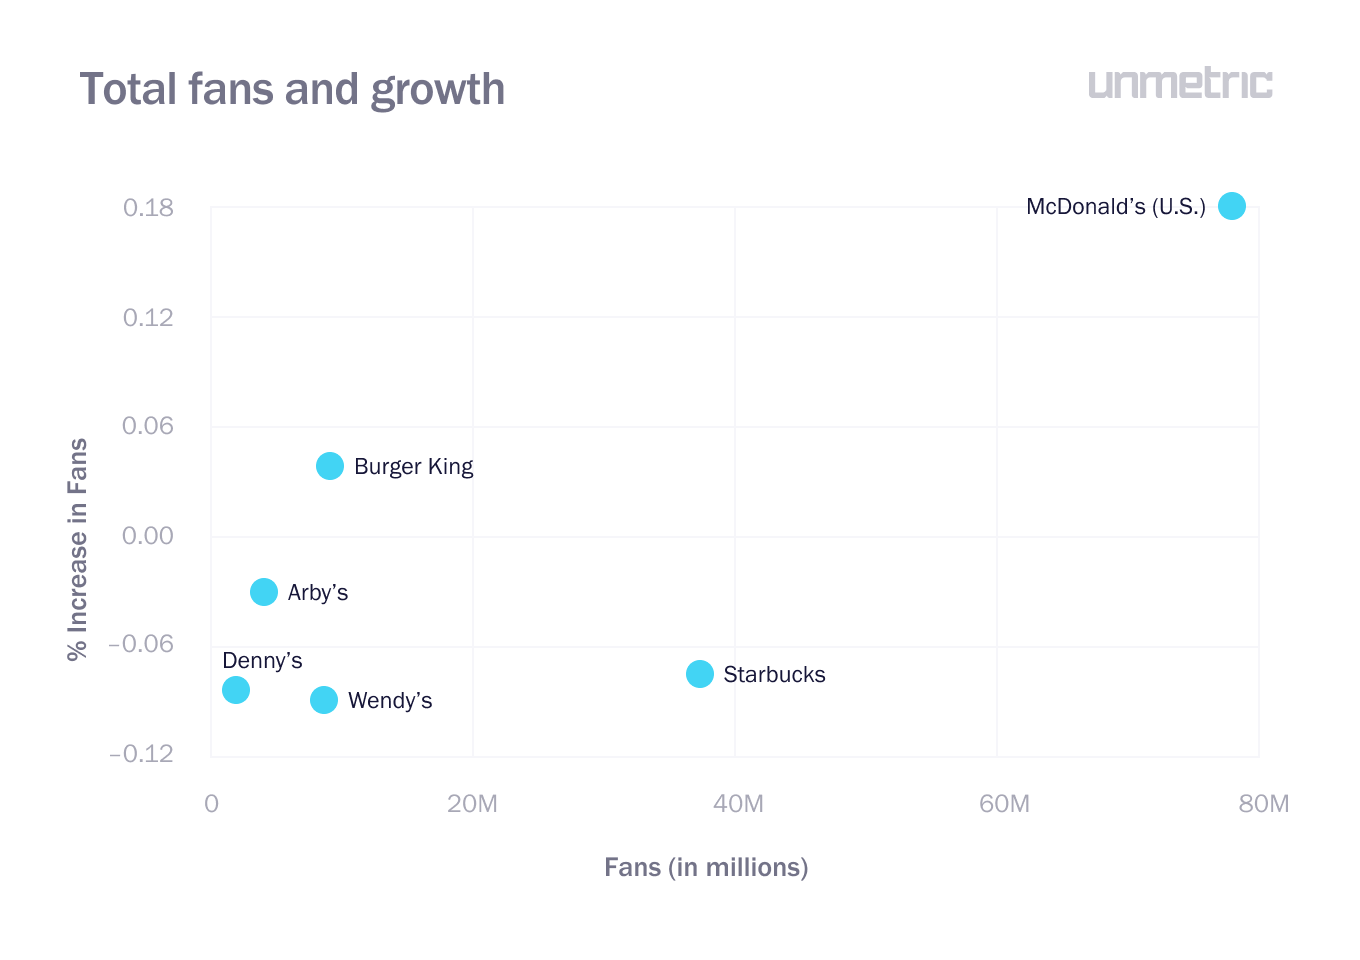
Copying this data into a report is simply reporting on metrics. It doesn’t try to provide any additional context about the chart.
Now if the analyst was to add a line that said:
McDonald’s grew their fan base the quickest in the time period analyzed and had the largest audience size
That line above is giving the user information. The chart data has been interpreted and information has been provided.
If you are reporting to a boss or client, that’s all they might be happy with. Most people will stop there because that’s all they have to do.
A social media analyst will ask: why?
Why did McDonald’s grow their fan base the quickest in this time period? What did they do that helped them grow?
The answer may be that McDonald’s brought back their popular Monopoly game. Maybe the brand was in the media. Maybe someone found a mouse in their chicken nuggets.
A good place to start is to see whether the growth was sustained over the entire period, or did the growth come from a few growth spurts.
In the chart below, we can see that McDonald’s high growth came early in the month, adding over 170,000 new fans in two days, before leveling off to add around 1,000 new fans.
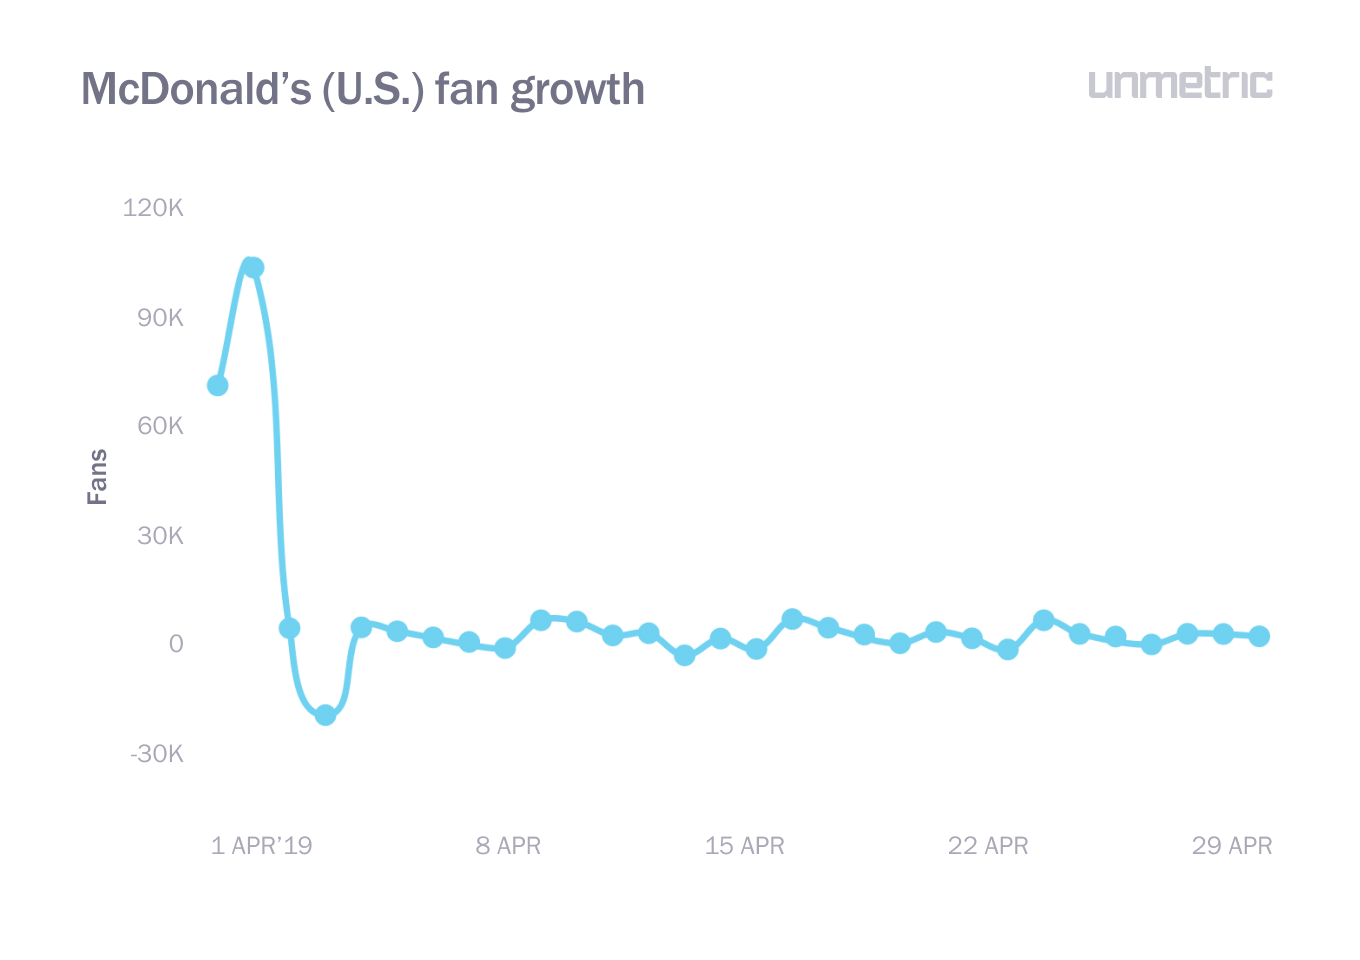
If it was a sustained growth, then you might be hard-pressed to find why. If it came in a couple of growth spurts, then the next step is to see what the brand published around this date to see if it could have impacted the growth.
In the example above, the social media analyst’s next job is to find out what caused such a spike in fan growth over the two days in early Apri.
What tools do social media analysis use?
To do social media analysis, you need to have access to a social media analytics tool. Some of these are, quite simply, like your Facebook Insights or Twitter Analytics which you get with your brand profiles.
Others are more advanced. For example, Unmetric is a social media competitive analysis tool that helps you analyze the competition and understand exactly what they are doing to get great engagement (or not, as the case may be).
Native social media analytics tools
Each social network provides you with analytics options to understand how your brand profile is performing on that social network. The amount of data that they provide is lacking in many places though, and some, like Facebook Insights, are better than others.
Facebook Insights
Facebook Insights gives you just about enough data to do an analysis of your own performance.
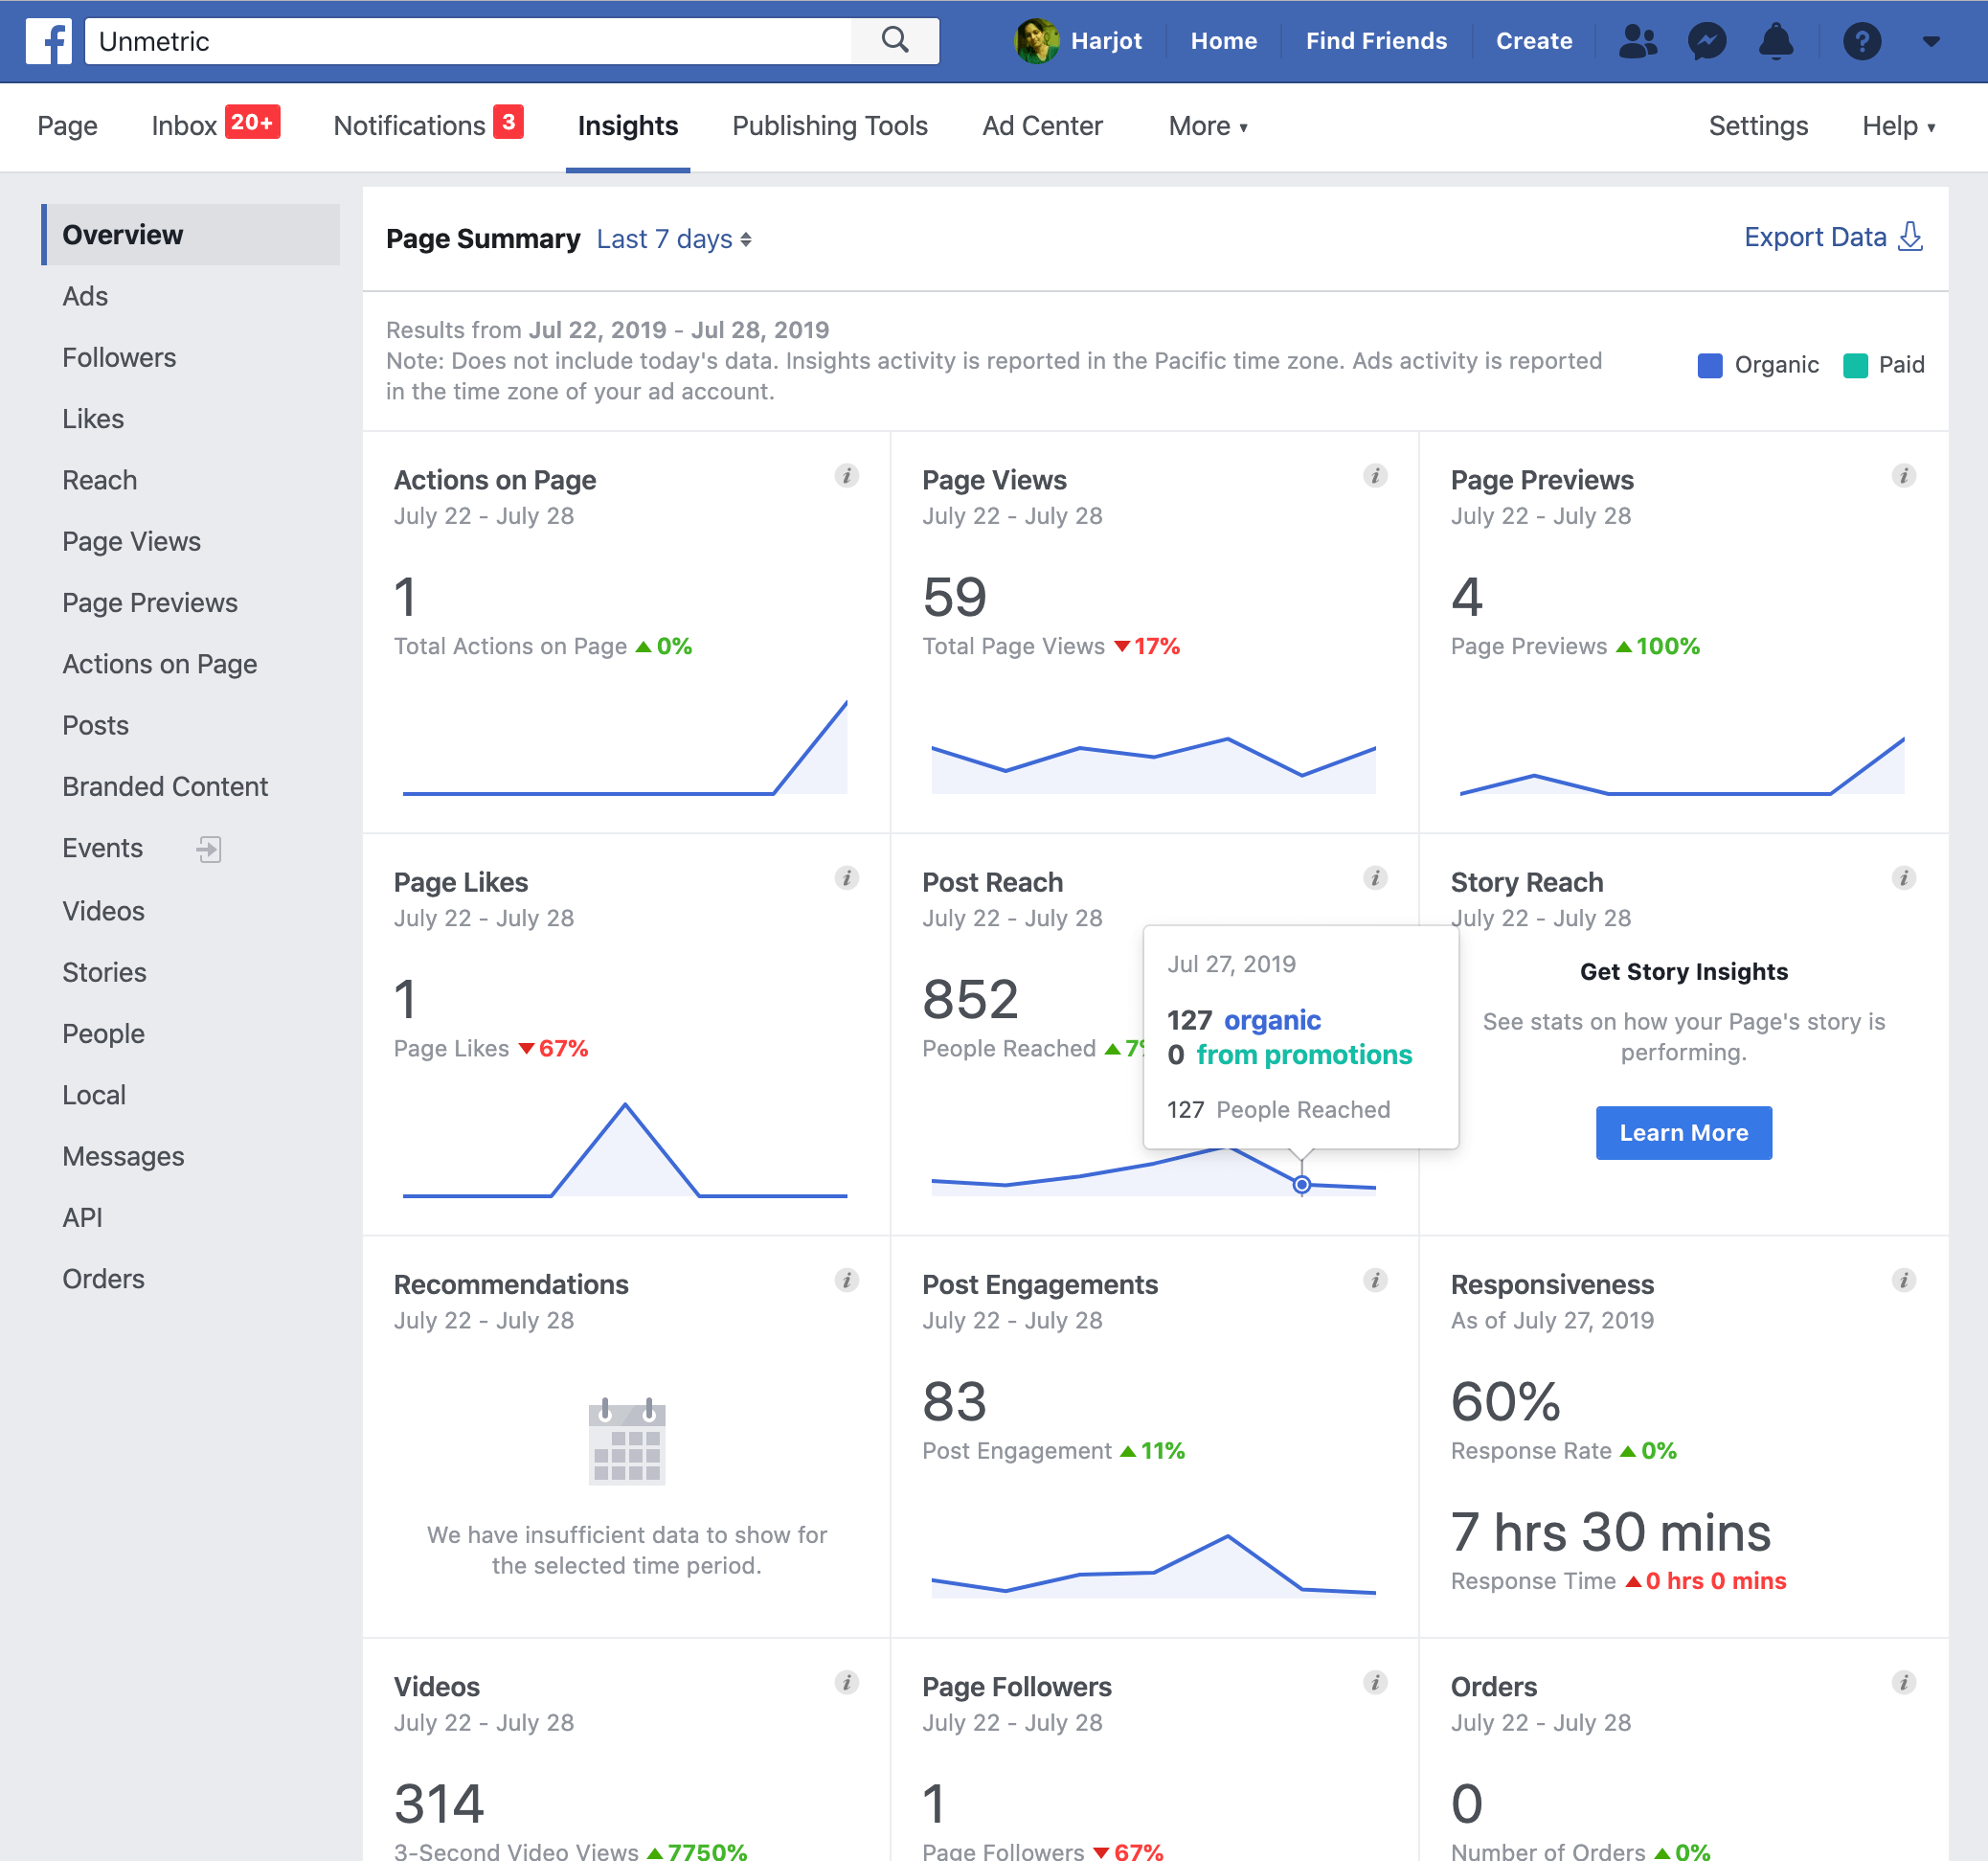
It has a competitor tracking ability, but the data analysis that can be done with it is very limited. At best, it’s a high-level overview of what your competitors are doing, but you can’t do a deep dive to see what’s working for them. Even worse, the pages are ranked by the number of fans, which is not a great way to rank a brand’s performance.
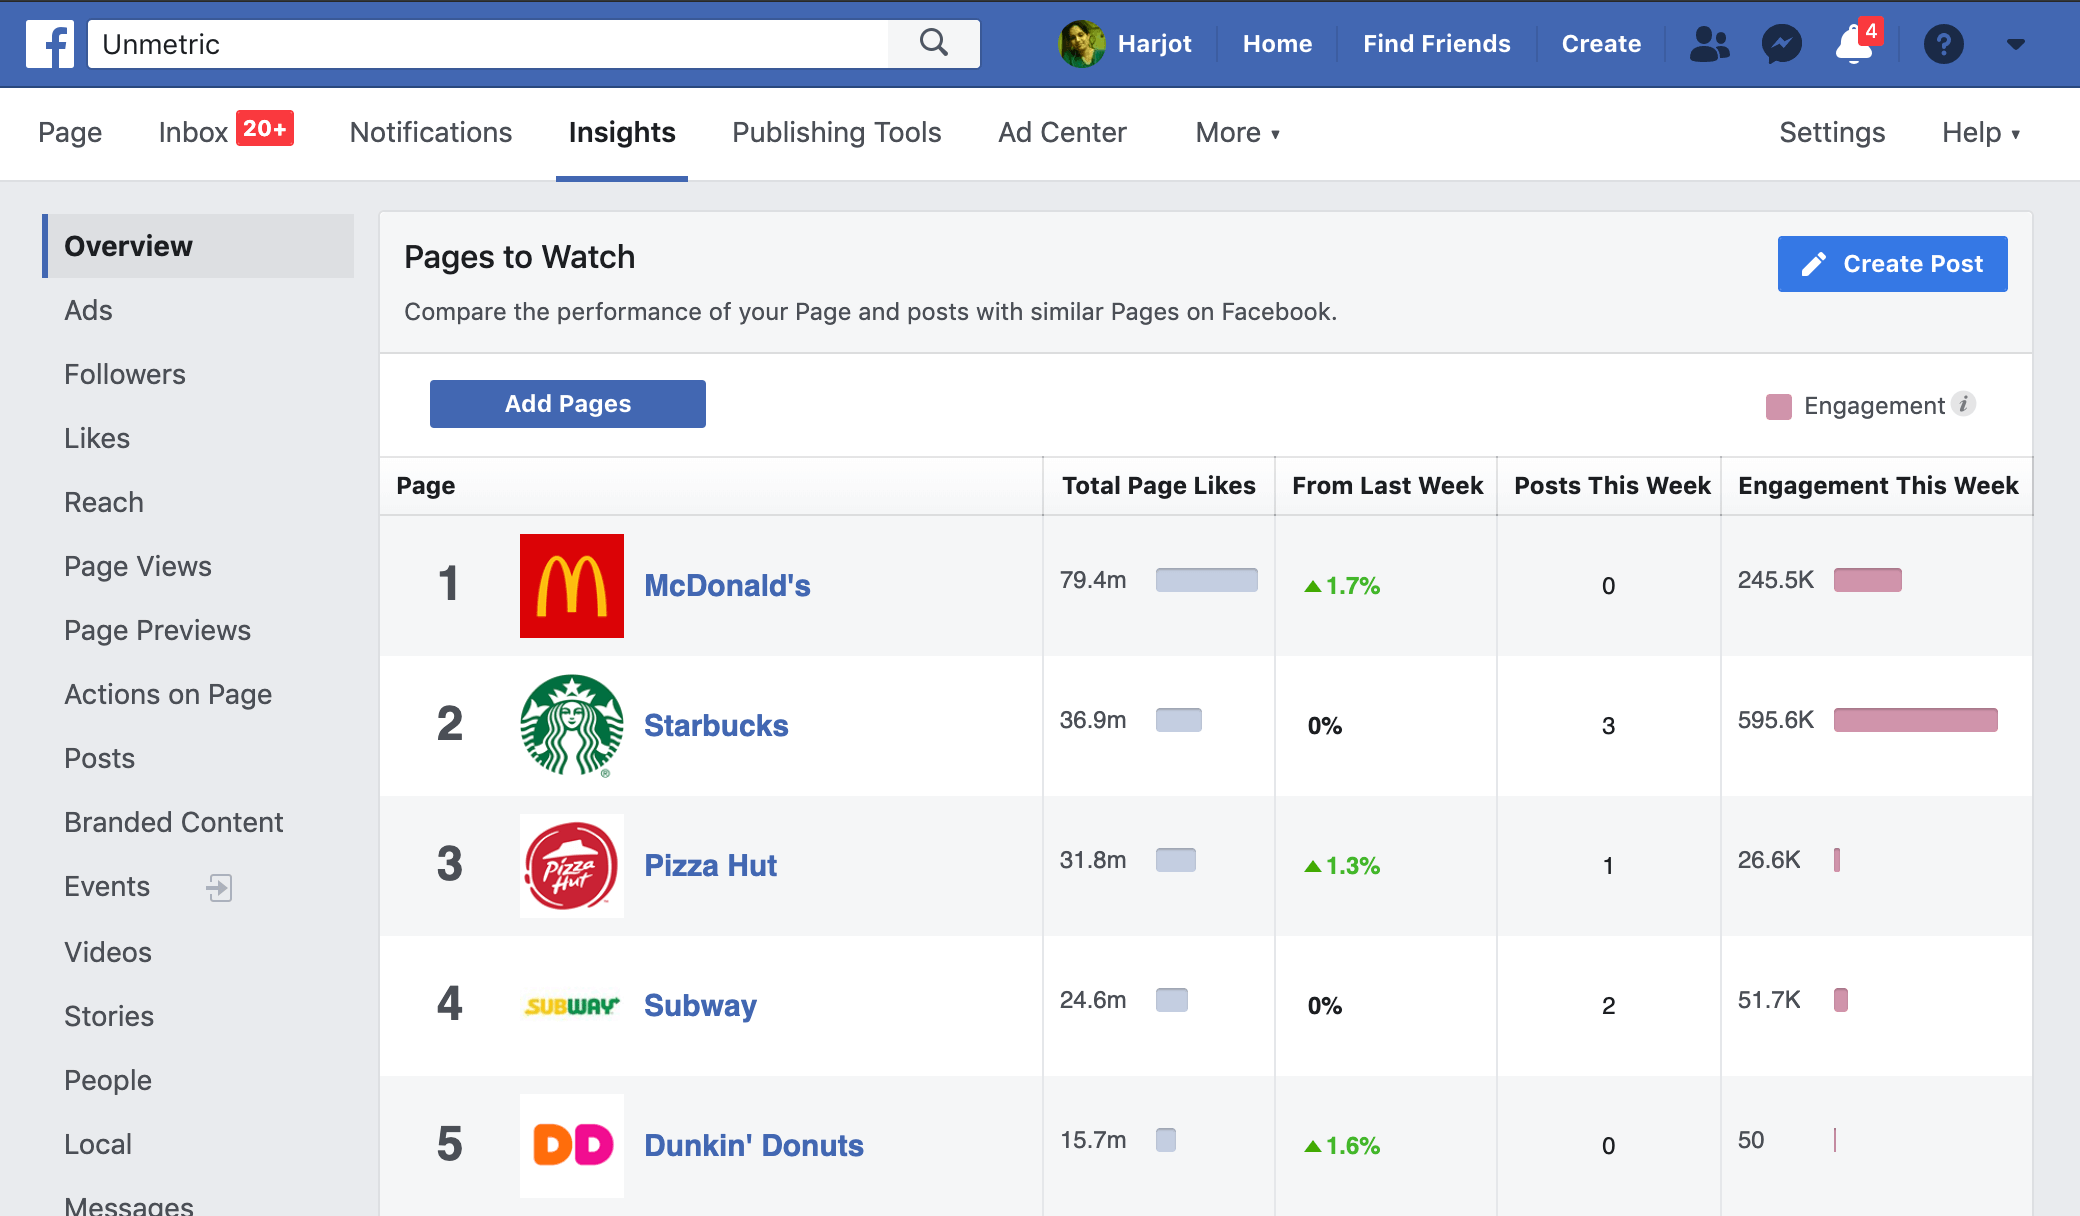
There are dozens of third-party tools that can help you get more from your Facebook analytics.
Unmetric is one of them and has additional metrics such as telling you which posts your competitors have boosted as well as estimating their reach and impression data. This helps you do an even deeper analysis by understanding why a certain competitor post got high engagement (ie. was it boosted?).
Instagram Insights
The main drawback of Instagram Insights is that it’s only available natively through the app with no option to export your data.
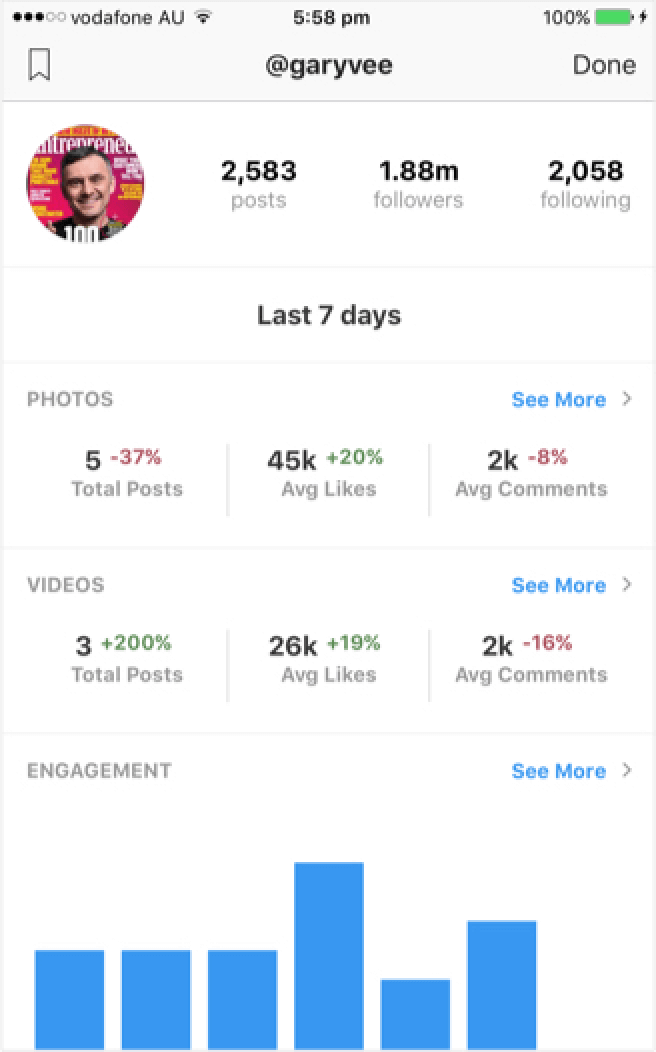
That’s why many brands that are serious about doing a thorough Instagram analysis choose a third-party tool, like Unmetric Analyze. Third-party Instagram analytics tools offer the ability to connect to your Instagram account so that you can view your data on a desktop, and even export the data into a report. Unmetric Analyze goes one step further by letting you do an analysis of your competitors on Instagram.
Twitter Analytics
Twitter’s own analytics tool is lightweight but provides you with enough information to get a sense of how your Twitter social media strategy is panning out.
Annoyingly, it only lets you analyze six months of data at a time, so you can’t compare your 2018 to your 2019 performance, for example.
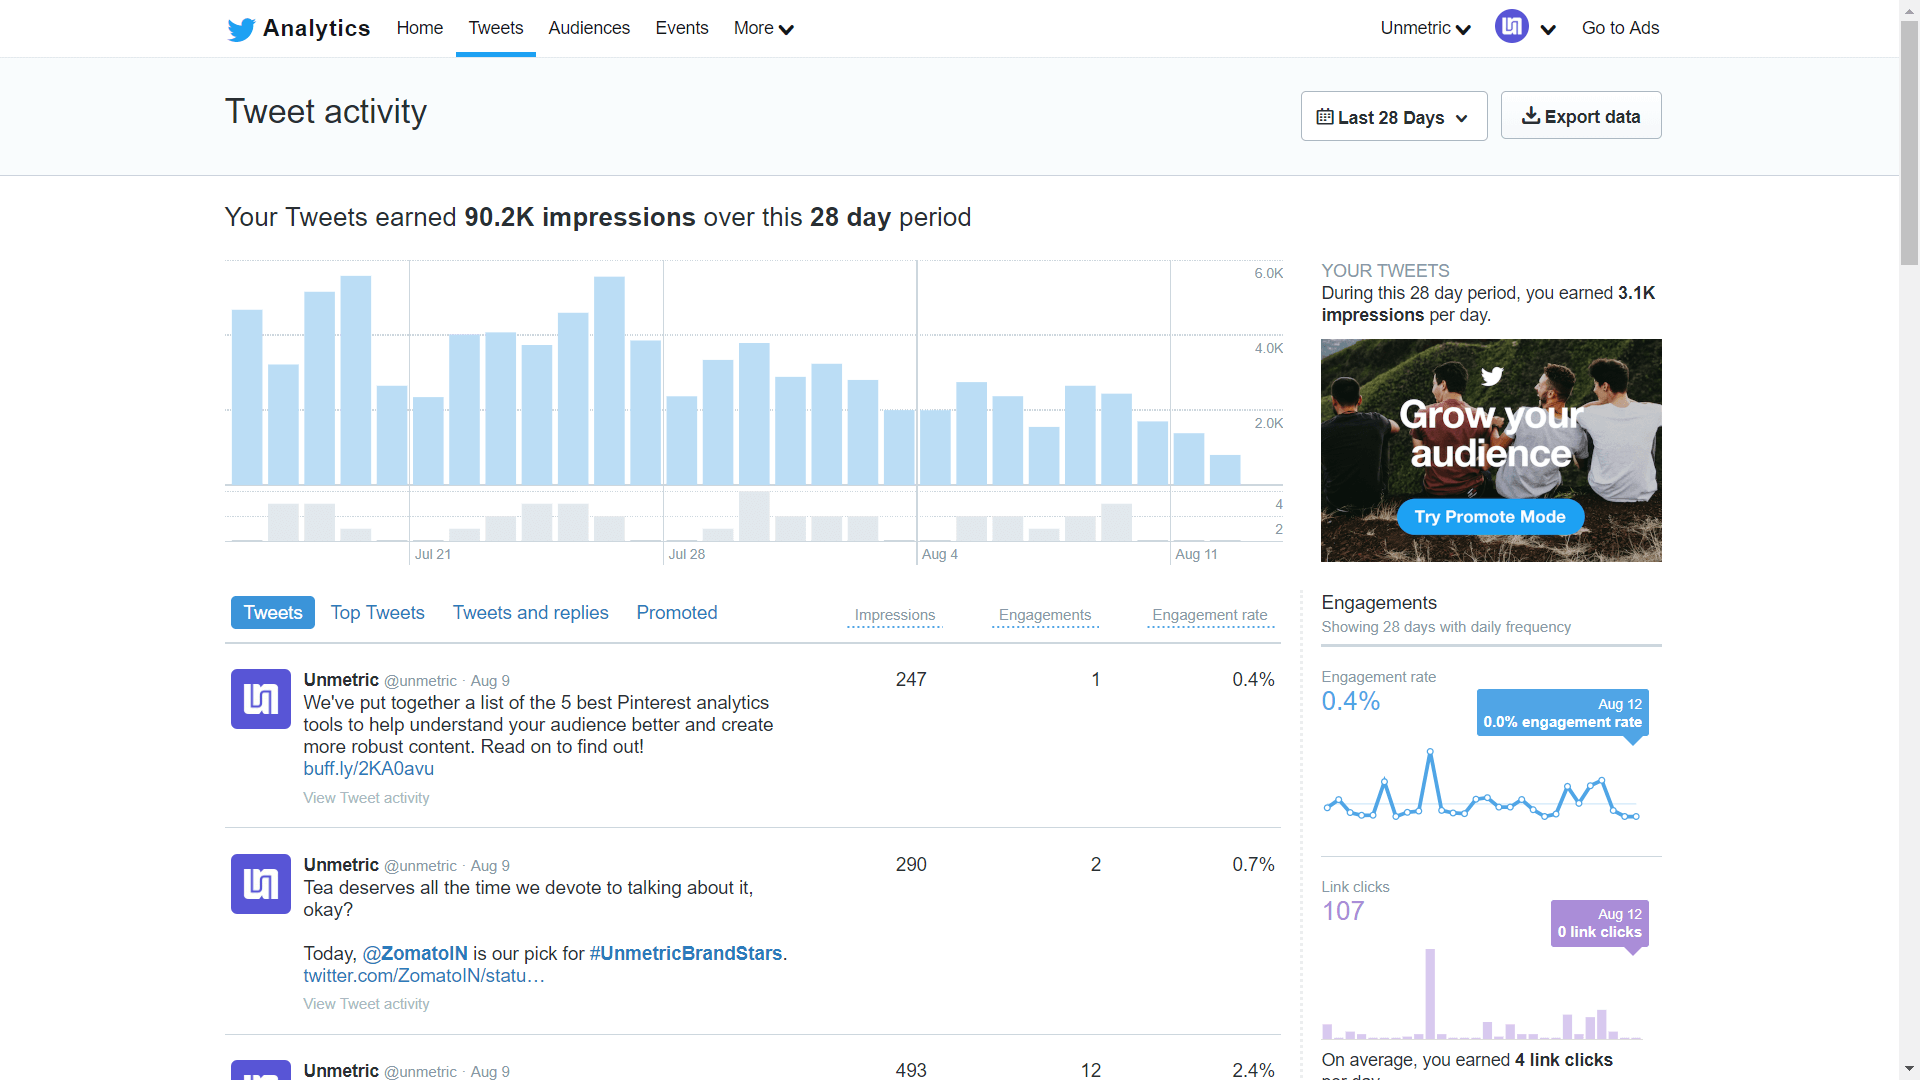
Like other native social analytics tools, Twitter’s analytics tool doesn’t provide you with any competitive data. This means you can’t benchmark your efforts against your competition, nor check what your competitors are doing that’s earning them great engagement.
To benchmark your Twitter performance, you need to use a third-party Twitter analytics tool. There are dozens to choose from. Unmetric has been gathering data on tens of thousands of Twitter accounts for the last 7 years.
You can use Unmetric to compare your performance against your competitors, discover the hashtags that are engaging the best, check how fast your competitors reply to customers, and check all the Twitter ads they’ve run.
YouTube Analytics
YouTube’s analytics dashboard has a wealth of data. It’s also one of the most closed platforms in terms of importing your data into a third-party app. Within YouTube analytics, you can get some useful metrics such as audience retention rate, which shows you how long average people watch your videos for.
Unfortunately, useful metrics like this are not available in third-party analysis tools. Additionally, YouTube’s native analytics platform doesn’t let you benchmark your metrics against other brands. So if your video retention rate is 46%, you don’t know if that’s good for your industry.
Third-party YouTube analytics tools like Unmetric might not be able to offer you the same range of insightful metrics like the YouTube analytics dashboard, but they do help with other things. For instance, Unmetric can help you benchmark performance against some top-line metrics such as views, subscribers, and video engagement.
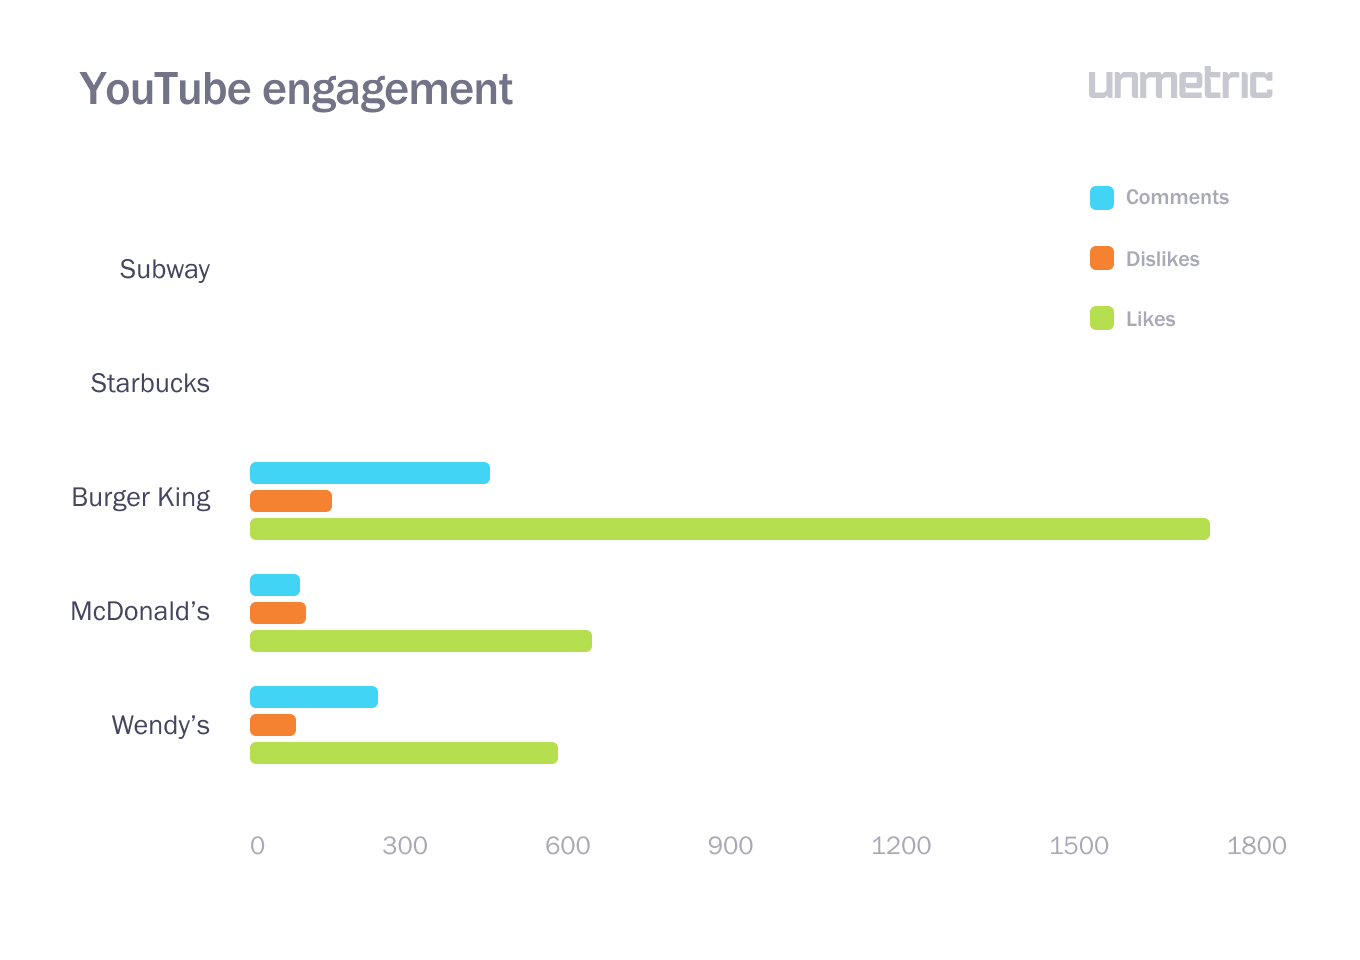
You can even perform more in-depth analysis like understanding if longer videos tend to get more views than shorter ones.
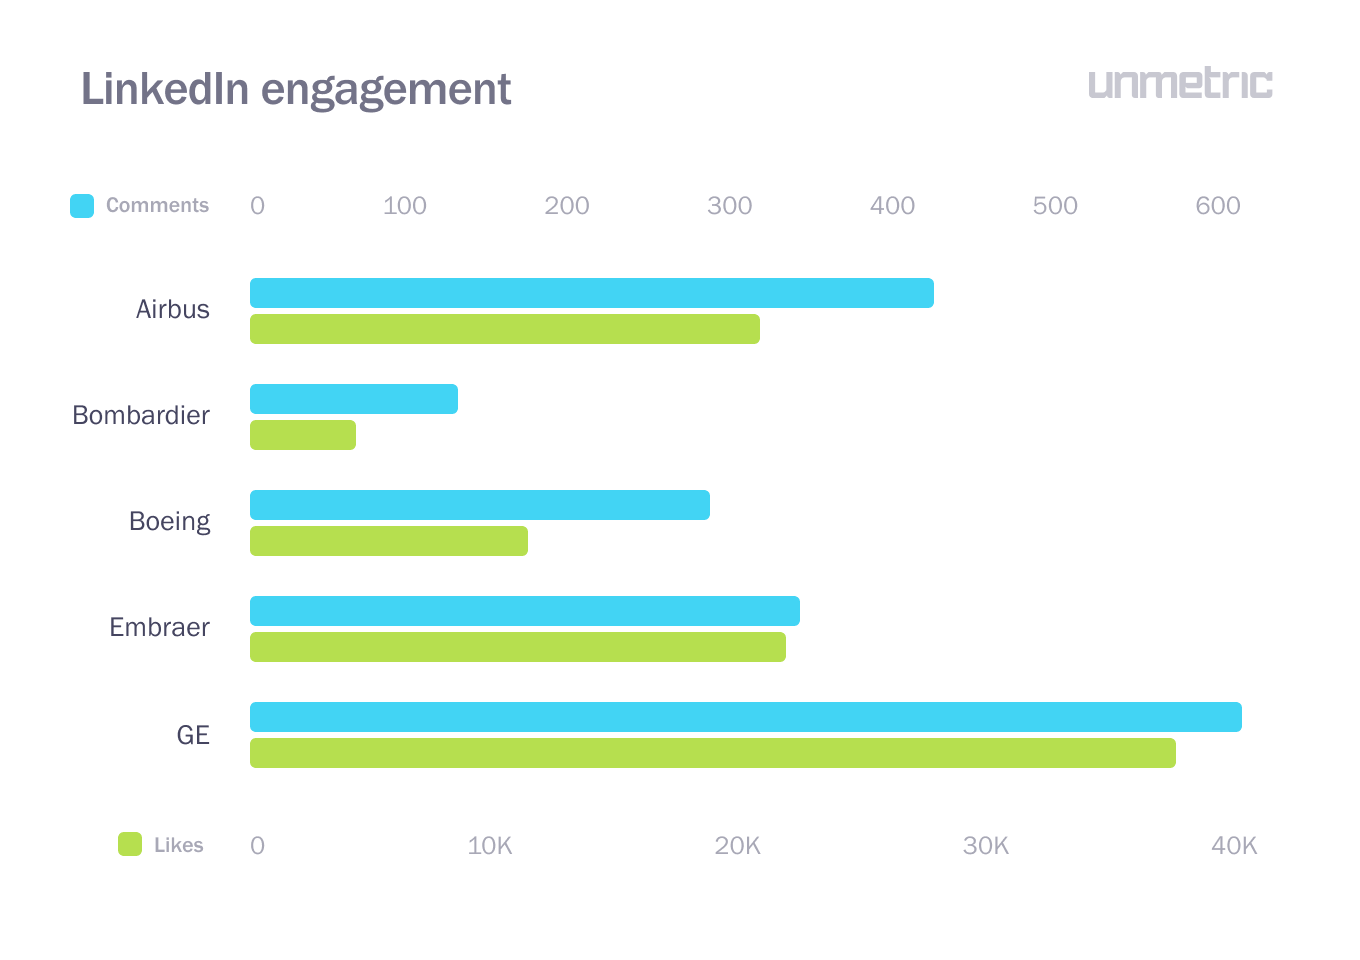
LinkedIn Analytics
LinkedIn’s native analytics section has improved over the years and now sits alongside Twitter’s native analytics in terms of its usefulness. It’s a great way to keep on top of how your brand is performing as it shows you how much engagement each post got, how many new followers you received, and gives you a breakdown of the type of people following your page.
You can also check historical data for your channel over a large period of time and download it to Excel for further analysis.
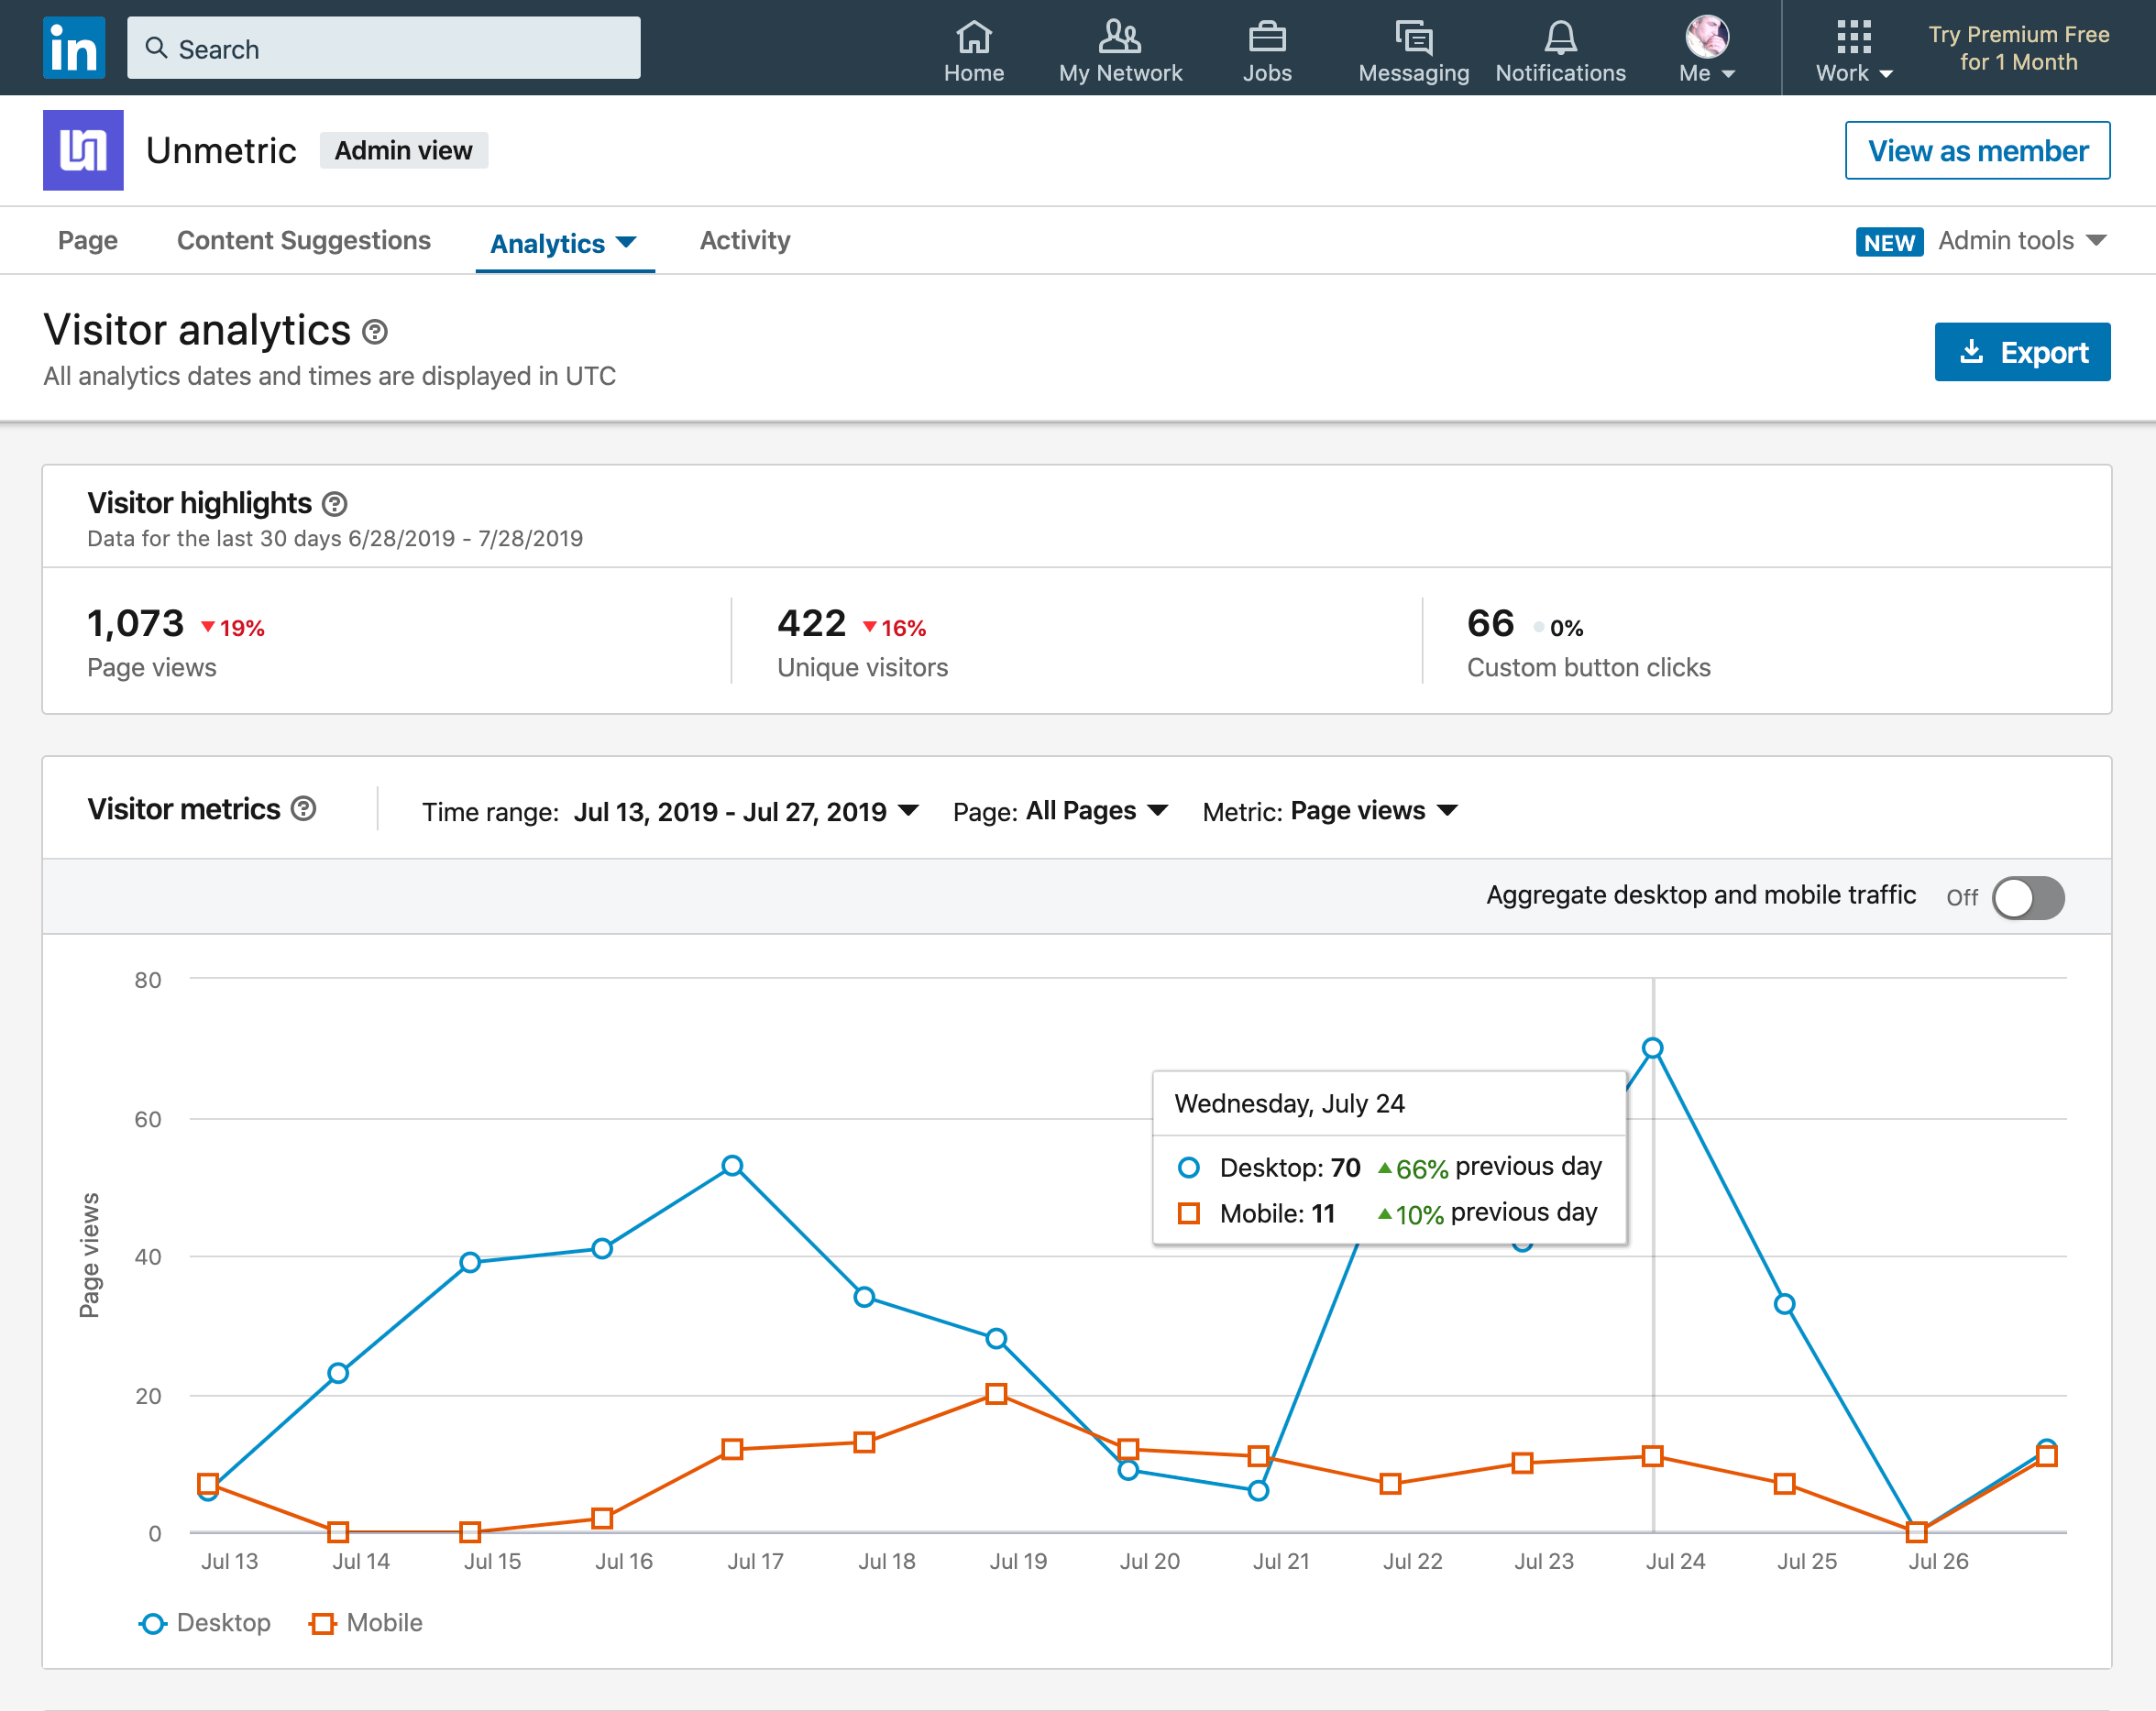
However, there are some serious limitations. You can’t sort your posts by the most engaging to find out what kind of content resonates best with your audience.
There’s also no competitive intelligence options – you can’t keep tabs on your competition to see what they are doing and how they are engaging their fans.
This lack of competitive intelligence means that you can only do half a job of your social media analysis—you’re missing the bigger picture. If you don’t know what targets to be aiming for, how will you know when you get there?
There are not a lot of LinkedIn analytics tools available, mostly because the LinkedIn API is horrible. Unmetric is one of the few LinkedIn social media analytics tools that tracks data on your own page and of your competitors. You can benchmark your performance and see how it compares with your competitors and industry.
These benchmarks help give you targets to achieve in terms of follower growth and engagement, as well as providing you ideas on what kind of content to post about.
Pinterest Analytics
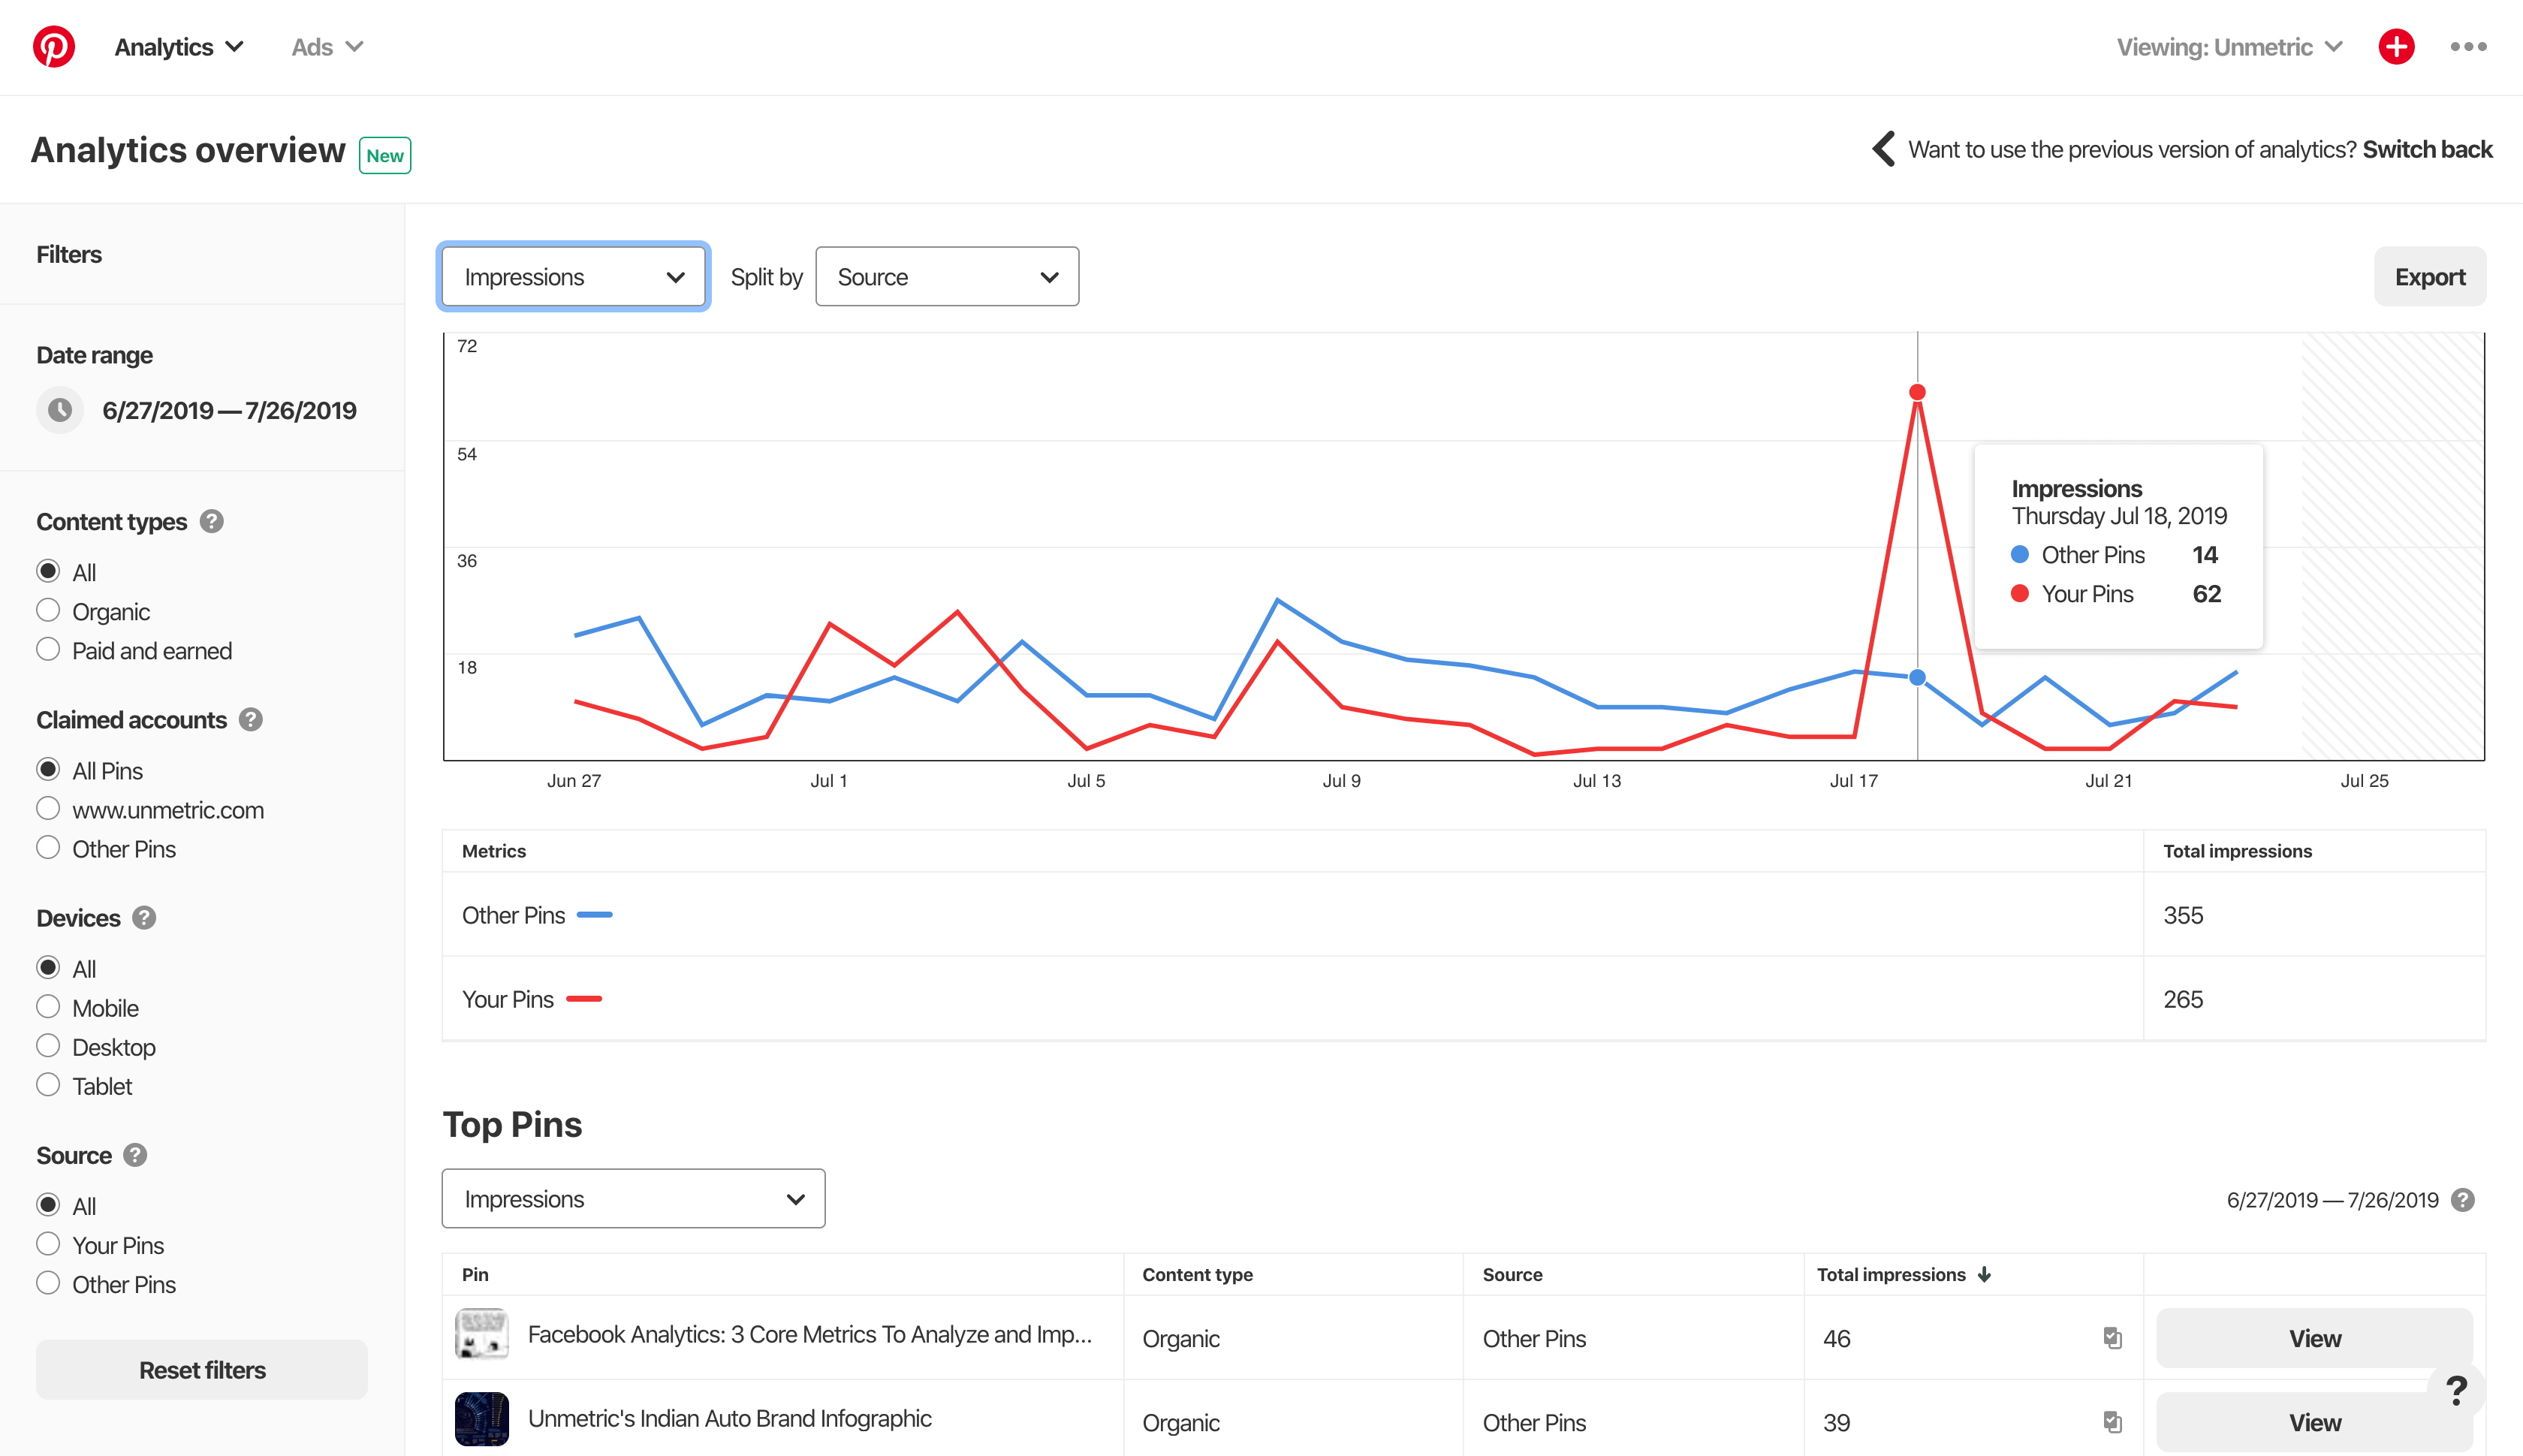
The native Pinterest analytics dashboard is okay for analyzing your own performance.
You can see all your pins in one place and the total engagement that they got. You can also see these metrics as a trending chart so you can spot when there are spikes in engagement.
However, the drawbacks for Pinterest’s native analytics are the same for all native social media analytics: There’s no competitive data. Your Pin about a new product might have received 250 engagements, but without anything to compare it against, is that good? Should you be getting more?
Competitive intelligence is a key aspect of any social media analytics program, and without it, you’re missing out on the bigger picture.
Like with LinkedIn, the Pinterest API is not great and restricts the amount of data that third parties can pull from the social network. That said, there are a number of Pinterest social media analytics tools available.
Unmetric tracks tens of thousands of brands on Pinterest. This means that you can get intelligence on what’s working for other brands and compare your own performance against your competitors and industry to see how your efforts stack up.
Getting the most from your social media analysis
Remember, analyzing your social media performance isn’t about putting data into a report and sending it to your boss.
There need to be some actionable takeaways. Look to answer questions like:
- Am I growing my fanbase fast enough?
- What are my competitors doing to grow their fanbase quicker than mine?
- Do I post enough content?
- Am I posting content at the right time?
- Is the amount of engagement I get good, bad, or okay?
- Is one particular category of content getting more engagement than the others?
- Is there a content category that’s not helping my engagement but takes a long time to produce?
- Am I boosting enough posts?
- Do my competitors get more engagement because they boost their posts or because they have great content?
- How fast should I be replying to customer questions on social?
- Do my competitors reply faster or slower than I do?
- What content worked for previous holidays and events that I can use to help inspire the content for this year?
There are many more questions like this that your social media analysis should look to answer, but this is a jumping-off point.
To really do a good job of your social media analysis, use a tool like Unmetric. You can track all your own channel analytics in one place–no more clicking around from one social network to the next–and keep tabs on what your competition is doing.
You can benchmark your performance to understand whether your strategy is paying off, just chugging along, or needs to be reworked to be as effective as your industry.
Perform social media analysis with Unmetric