Ultimate Guide to Instagram Analytics
In this article, we take a look at how marketers can find Instagram metrics and leverage Instagram Analytics.
Table of Contents
- Why you need Instagram analytics
- What to look for in an Instagram analytics tool
- Instagram metrics
- Metrics to analytics
- Understanding insights from analytics
- Injecting insights to strategy
Why you need Instagram analytics
As a true blue millennial, I’m an Instagram addict. I have sleepless nights thanks to the never ending Explore feed which forces me to do just one more swipe to see what’s next. As a marketer, I also have sleepless nights because of the lack of an analytics dashboard within Instagram for regular posts.
With the recent possibility of an algorithmic feed, marketers are even more keen to access Instagram analytics and gain actionable insights on how their content is performing. Since Instagram doesn’t offer a native analytics dashboard yet, third party tools are a marketer’s best bet.
If you’re an individual and are simply looking for top level metrics, there are a lot of free tools out there. However, for brands or companies looking to do serious Instagram marketing, deeper insights such as engagement, frequency and content strategy are essential. Instagram analytics for such companies is available from a variety of vendors. Before you choose your vendor, here is how to choose your tool.
What to look for in an Instagram analytics tool
The market is inundated with tools. For analytics, you’ll find tools that range from giving you single metric analytics to tools that give you data dumps that are close to impossible to decipher. However, as a marketer that only needs the insights or as an analyst that needs the important numbers to present, tools that give you a broad overview of performance along with detailed analytics on specific metrics is essential.
Before I specify the qualities to look for in a perfect tool, I’m going to outline what most marketers look to get out of Instagram analytics.
Insights marketers look for:
- Follower behaviour
- Content performance/ Engagement
Features they need to get these insights:
- Breakdown of top level metrics such as Like and Comments
- Details on Followers and growth
- Hashtag performance
- Filter based engagement
However, a few criteria that marketers forget (but shouldn’t) are report generation, data on timing, and competitive intelligence. Based on all that marketers want and need, here is a list of must-haves in your Instagram analytics tool:
- Control over engagement score for a view of performance irrespective of community size
- Ability to benchmarks your metrics – aka competitive intelligence.
- Option to allow multiple users to access the metrics
- Reporting engine to help export the data in a presentable manner
- Customization according to industry, geography, and metric.
Instagram Metrics
The obvious metrics are Like and Comments. Instagram doesn’t have a button similar to a “Share or “Retweet” yet. However, other metrics such as posting frequency, post timing, hashtag engagement and others can be crucial when looking at both own brand analytics and competitive data. Here is a list of all the metrics you must be tracking on Instagram.
- Likes
- Comments
- Engagement Score
- Hashtags Volume/Usage
- Hashtag Engagement
- Filters & Engagement Sector
- Follower Count
- Follower Growth Rate
- Followee Growth Rate
- Publishing Volume/Frequency
- Breakdown by Post Type
- Timing
- Industry, Geographic & Custom Benchmarks
Metrics to analytics
While it’s important to tabulate metrics, the next step is to analyze them and enrich the data. Though you can collate some metrics manually, some of these metrics aren’t available easily on Instagram. Tools like Unmetric allows you to download all this data for any time period in one click – in any format you like – as Excel, PPT, JPG etc.
Once you’ve got your own metrics in place, you can look at metrics such as Follower growth and engagement to understand where your brand stands in your target group’s mind. A comparison of your posting frequency with timing and engagement can tell you when your followers are most actively engaging with your content. Similarly, different metrics can inform your strategy.
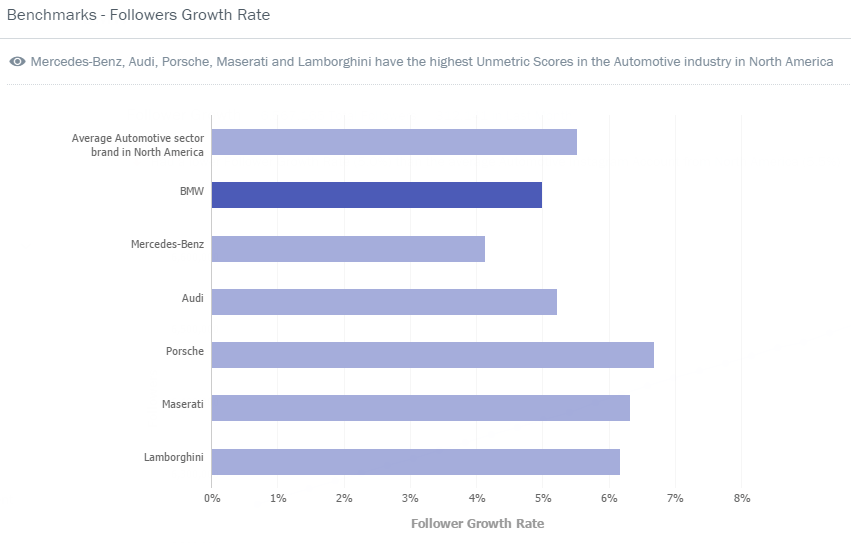
If you take a look at BMW they added over 300,000 followers in April 2016. Though this seems like a large number, it gives no context unless we compare it with the industry. The 300,000 translates to a 5% growth for the car brand, however, an average brand from the automotive industry has had a growth rate of 5.5% which puts things in perspective.
Understanding insights from analytics
Though your own metrics make a huge difference in making your marketing data-driven, it’s only the tip of the iceberg. To go the extra mile, analyze the performance of your competitor brands or your industries.
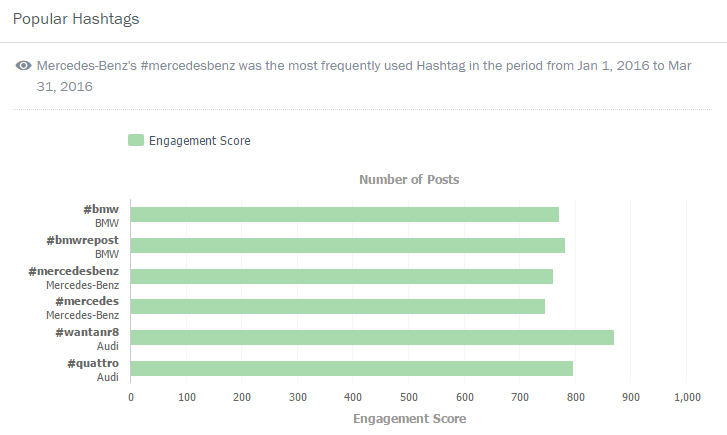
For example, Mercedes-Benz has high engagement on their brand hashtag #mercedesbenz, however, Audi has a higher engagement on their #wantanr8.
This means that hashtags about specific models or involving a personal preference aspect such as “want an” made the hashtag perform better for Audi.
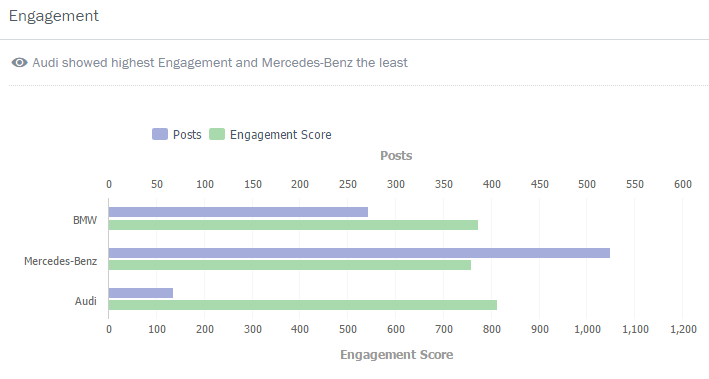
Similarly, though Mercedes has posted the most frequently, Audi received the highest engagement.
This probably means that Audi’s followers cherish the brand’s content since they don’t see it very frequently. Or this could also be a result of the quality of content. Comparing content could be a good way to interpret why this is going on.
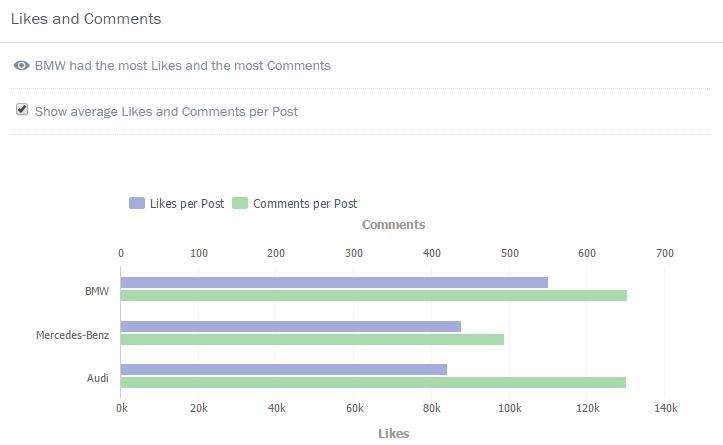
On further analysis, I was able to see that Audi gets more Likes/Comments on a per post basis.
Injecting insights to strategy
Insights are great to present at your monthly review meeting. They give a lot more meaning and back story to your analytics and metrics. However, the insights are best used when they are fed back into brand strategy to improve the numbers. Though this can only be done based on your brand’s goals. More on that here.
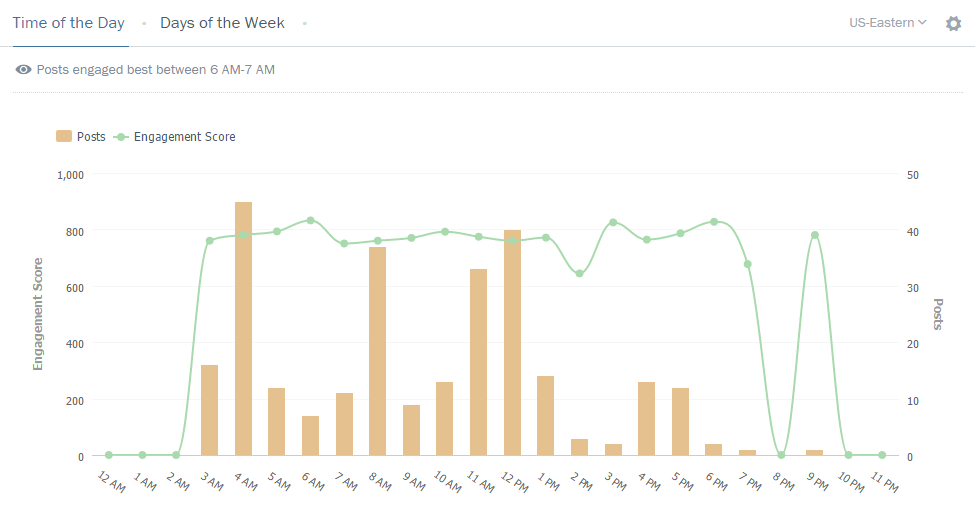
Let’s take a look at timing.
BMW gets high engagement at 9 PM, however, that’s when they post the least. Posting more around this window is sure to boost the engagement of the brand.
Likewise approaching Intstagram analytics with an all inclusive tool can help marketers make the shift from metrics to insights. Based on your company’s needs you can go in to different levels of detail. For example, if you simply need a deck to present numbers, Unmetric can help you pull a detailed PPT report with just a click. If you need ideas to optimize your strategy, metrics such as “Post types” will help you.
Keep in mind that the tool you pick could make the difference between data and intelligence. Of course budget and team size are variables to consider, which is why Unmetric provides flexible pricing plans exclusive for brands and agencies. Sound like something you’d like to try out? Sign up for a free trial and you can see how Unmetric makes all the difference to your Instagram analytics.

