
5 Trends in the American CPG Industry
Marketers have it tough in the CPG industry. When there are three or four products within the same category performing similar tasks to a similar degree of effectiveness, purchasing habits are formed early and can be hard to break. One method that psychologists have discovered is that the brand that creates the best experience through branding and advertising often becomes the preferred brand. This explains why in test after test, people prefer Coca-Cola when they know what they are drinking and Pepsi in a blind test.1 Like Pepsi and Coca-Cola, other CPG brands need to create experiences with their social media content to evoke a warm recall affinity for the brand when the consumer walks down the aisle.
In this report, we looked at the social media trends of 27 CPG brands in America on Facebook, Twitter and Instagram between 2013 and the end of Q1 of 2017. The brands included in this report are:
All data and charts sourced from: Unmetric Social Media Intelligence Platform
1 https://www.psychologytoday.com/blog/subliminal/201205/why-people-choose-coke-over-pepsi
Audience Growth by Size and Channel
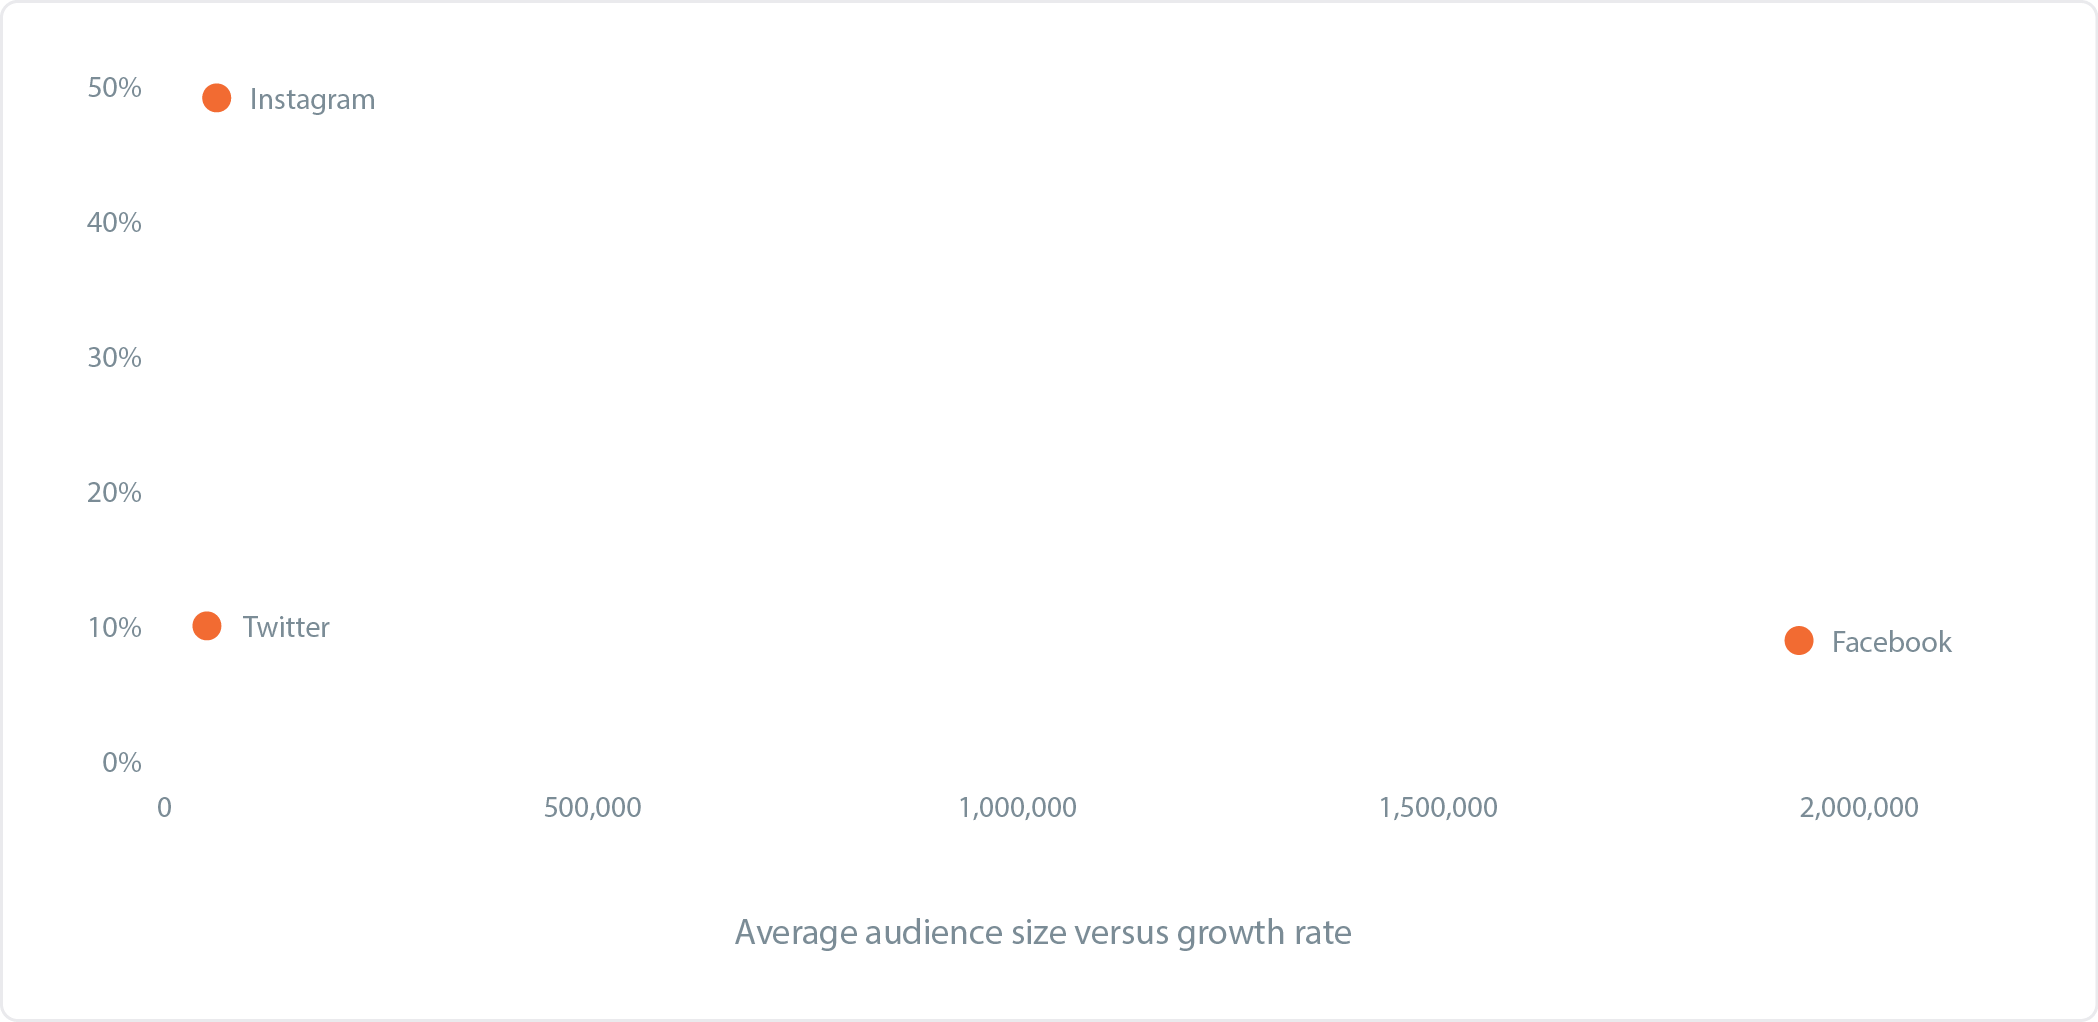
CPG brands need a wide reach to make sure their messages hit their target audience. Social media is being embraced by brands as the new mass media channel to advertise on, but the landscape has changed over the last five years, so where is the growth now? The chart below shows the average audience size and growth rates for each social network for the 27 CPG brands featured in this report. CPG brands have the largest average audience on Facebook and will remain so for some time to come. Instagram has overtaken Twitter to host the second largest average audience for CPG brands.
Where do CPG Brands Need to Focus Their Attention?
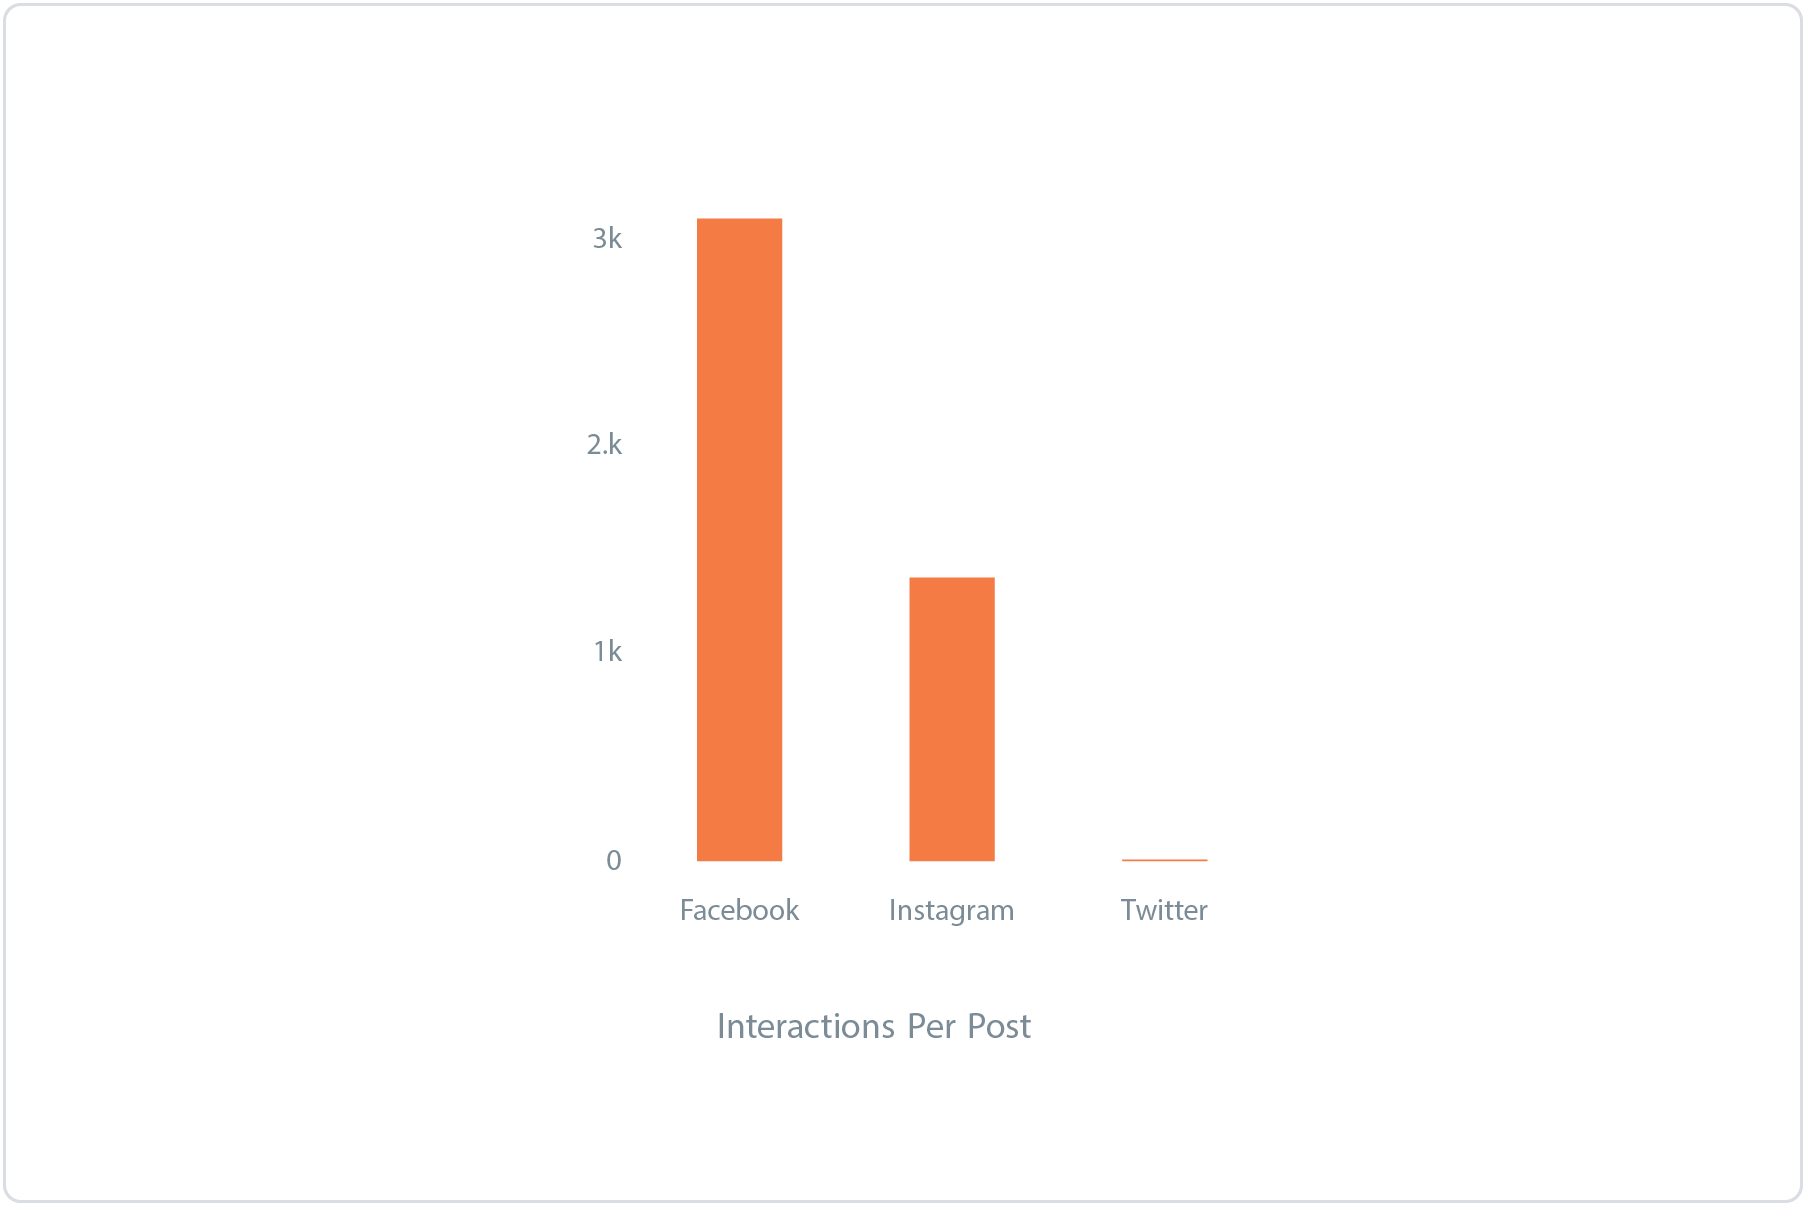
The bulk of everyday personal and home care CPG brands are bought by adults aged 18 and up (although feminine products may also target a younger audience). With new social networks like Snapchat and some challenger social networks like Instagram, it might be tempting for some brands to try out these new platforms. However, with Facebook reporting 234 million active users in North America, and dominating other social networks in terms of user engagement, the focus for CPG brands for now should remain on Facebook. Twitter performs poorly in terms of engagement but finds a niche for answering customer questions.
What are CPG brands in North America Talking About?
Using Unmetric Discover, a searchable database of over 500,000,000 pieces of brand content, the following topics were found to be the most popular talking points for the CPG brands analyzed in this report.
LAUNDRY
Used 2,200 times
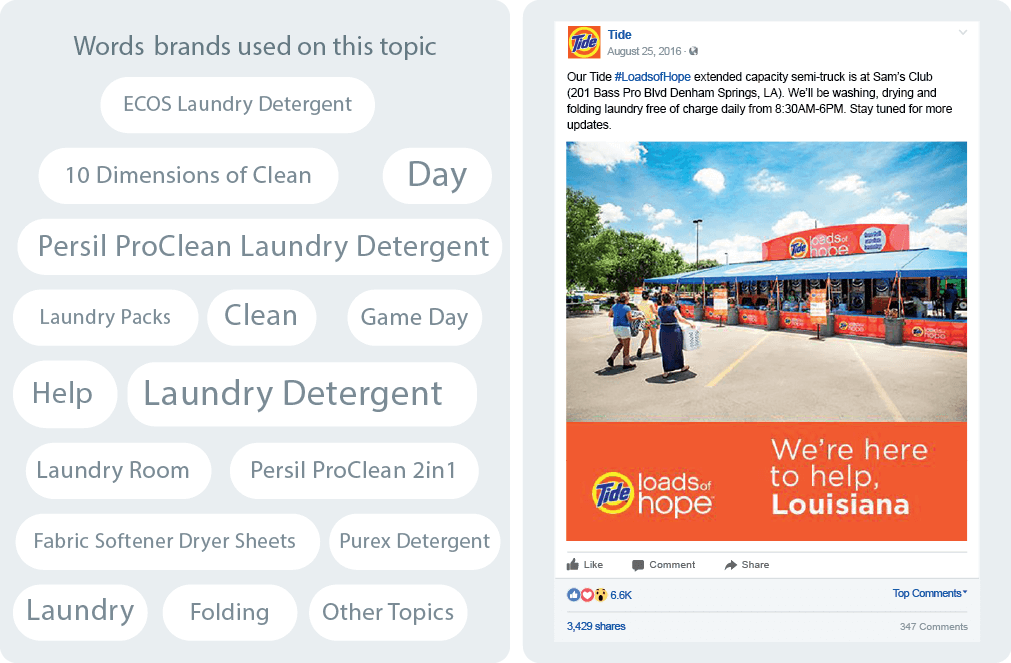
The #LoadsofHope campaign was the most engaging campaign by Tide and garnered 3,564 interactions per post. Stepping up during a time of crisis is something several CPG brands do and they create goodwill, engagement and media coverage as a result.
HEALTHY
Used 2,700 times
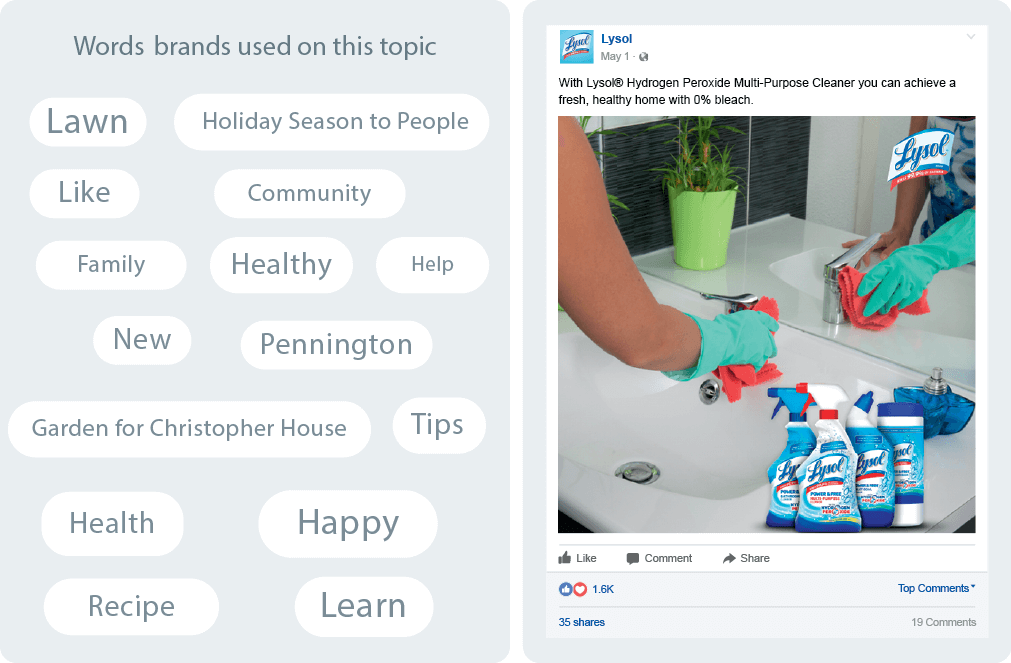
Most Home Care brands upsell consumers by marketing products as eco-friendly and safe to use at home. A particular focus is on the safety of family members by talking about products that don’t contain harmful ingredients like bleach.
Unsurprisingly, the majority of CPG brand content revolved around their products. However, this wasn’t always the most engaging type of content. When brands took up a cause related to their brand, this engaged far better than content around the products themselves.
PERIOD
Used 1,700 times
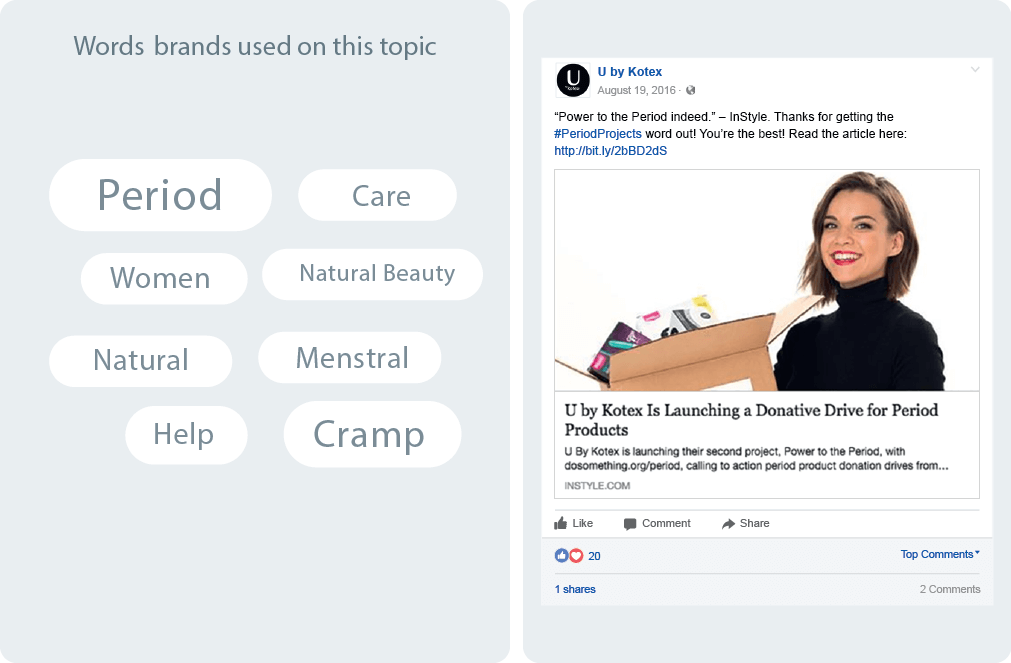
The most engaging content from the Personal Care sector was from companies that sold sanitary pads and tampons. They used various pain points to market their products such as having a clean period, etc. Most brands used the same strategy for this particular product.
DIAPERS
Used 1,100 times
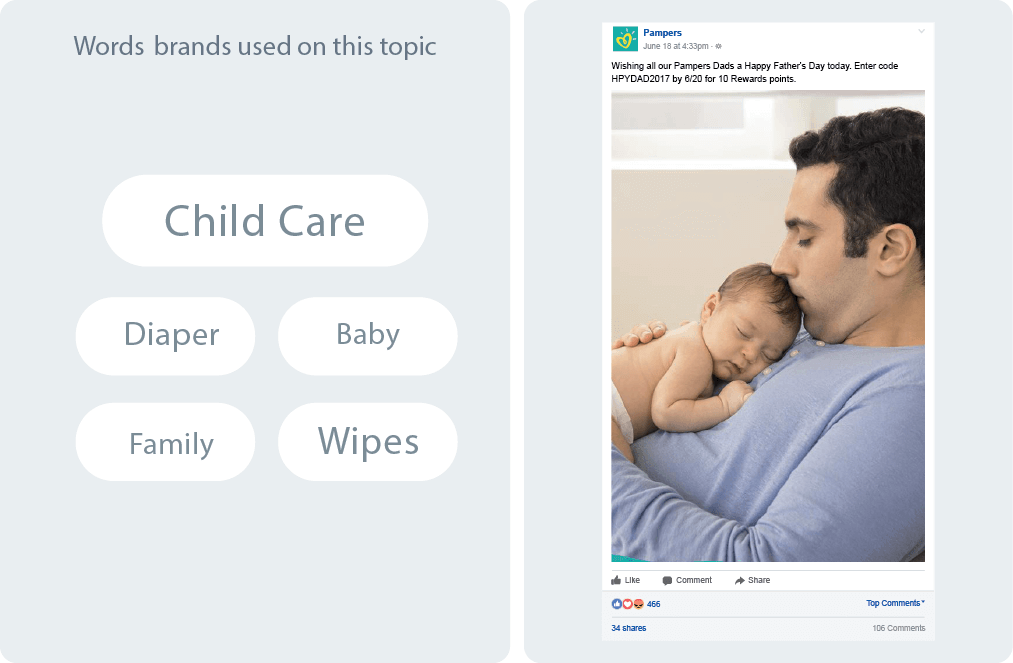
These brands primarily target parents (and parents-to-be) and hence capitalize on family occasions like Father’s Day to engage their audience.
Trends
Learn about five important trends that impact the CPG industry on social media
1. Brands are Publishing Less Public Content Than Ever
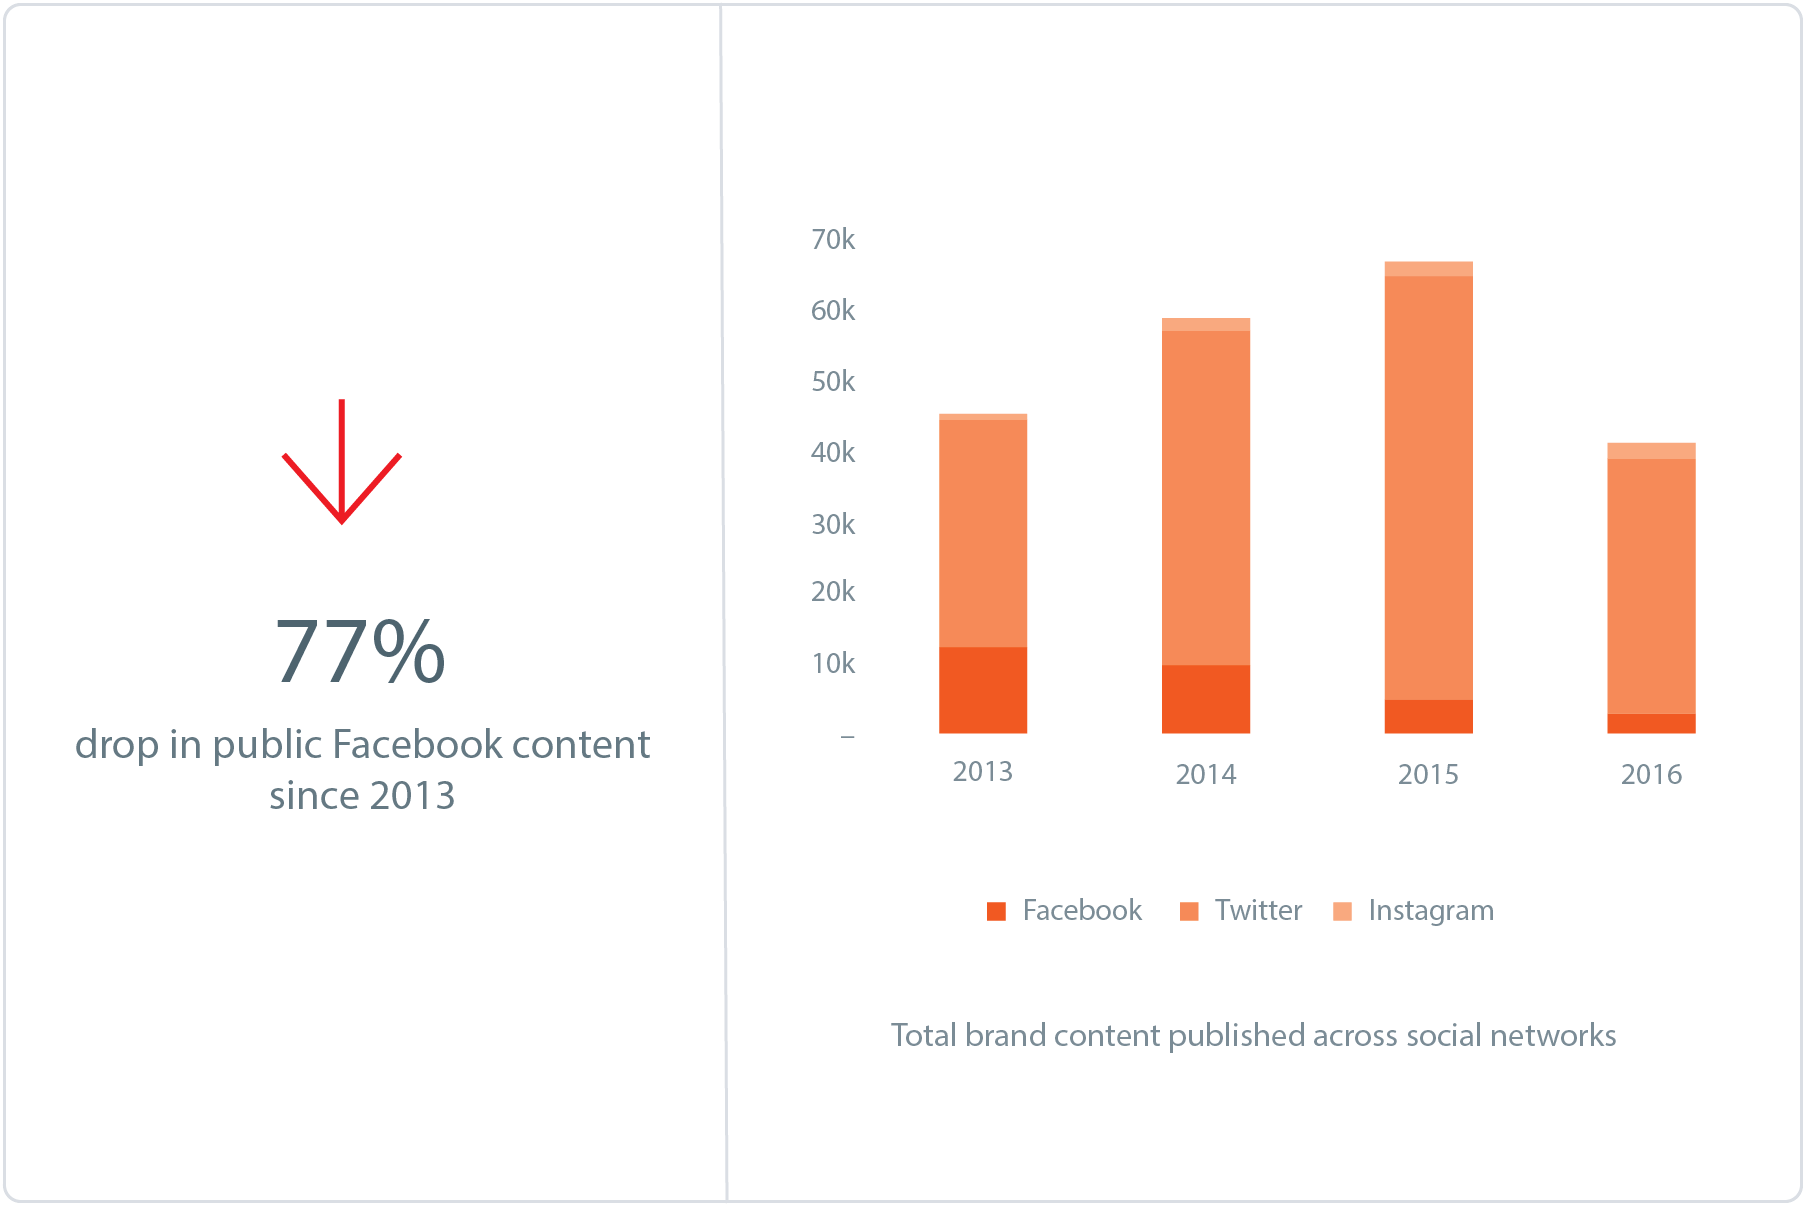
Between 2013 and 2015, CPG brands turned to Twitter to increase the total amount of content they published. On average brands published 6 tweets per day (including retweets and replies). On the other hand, there was a 77% drop in content published on Facebook between 2013 and 2016. This could be driven by a number of reasons including falling organic reach or budgets being transferred from content creation to content promotion. This doesn’t take into account ‘Dark Posts’ (sponsored posts which appear on a user’s timeline but not on the brand’s Facebook page), and brands could be leveraging them more than publicly visible content.
- Kleenex increased the number of tweets they published by 8,269% between 2013 (32) and 2016 (2,687). 94% of these tweets were replies.
- Dawn virtually stopped publishing content on its Facebook page in 2016. Total posts were down by 98% in 2016 (11) compared to 2013 (474).
2. Interactions Per Post Are Increasing Year Over Year
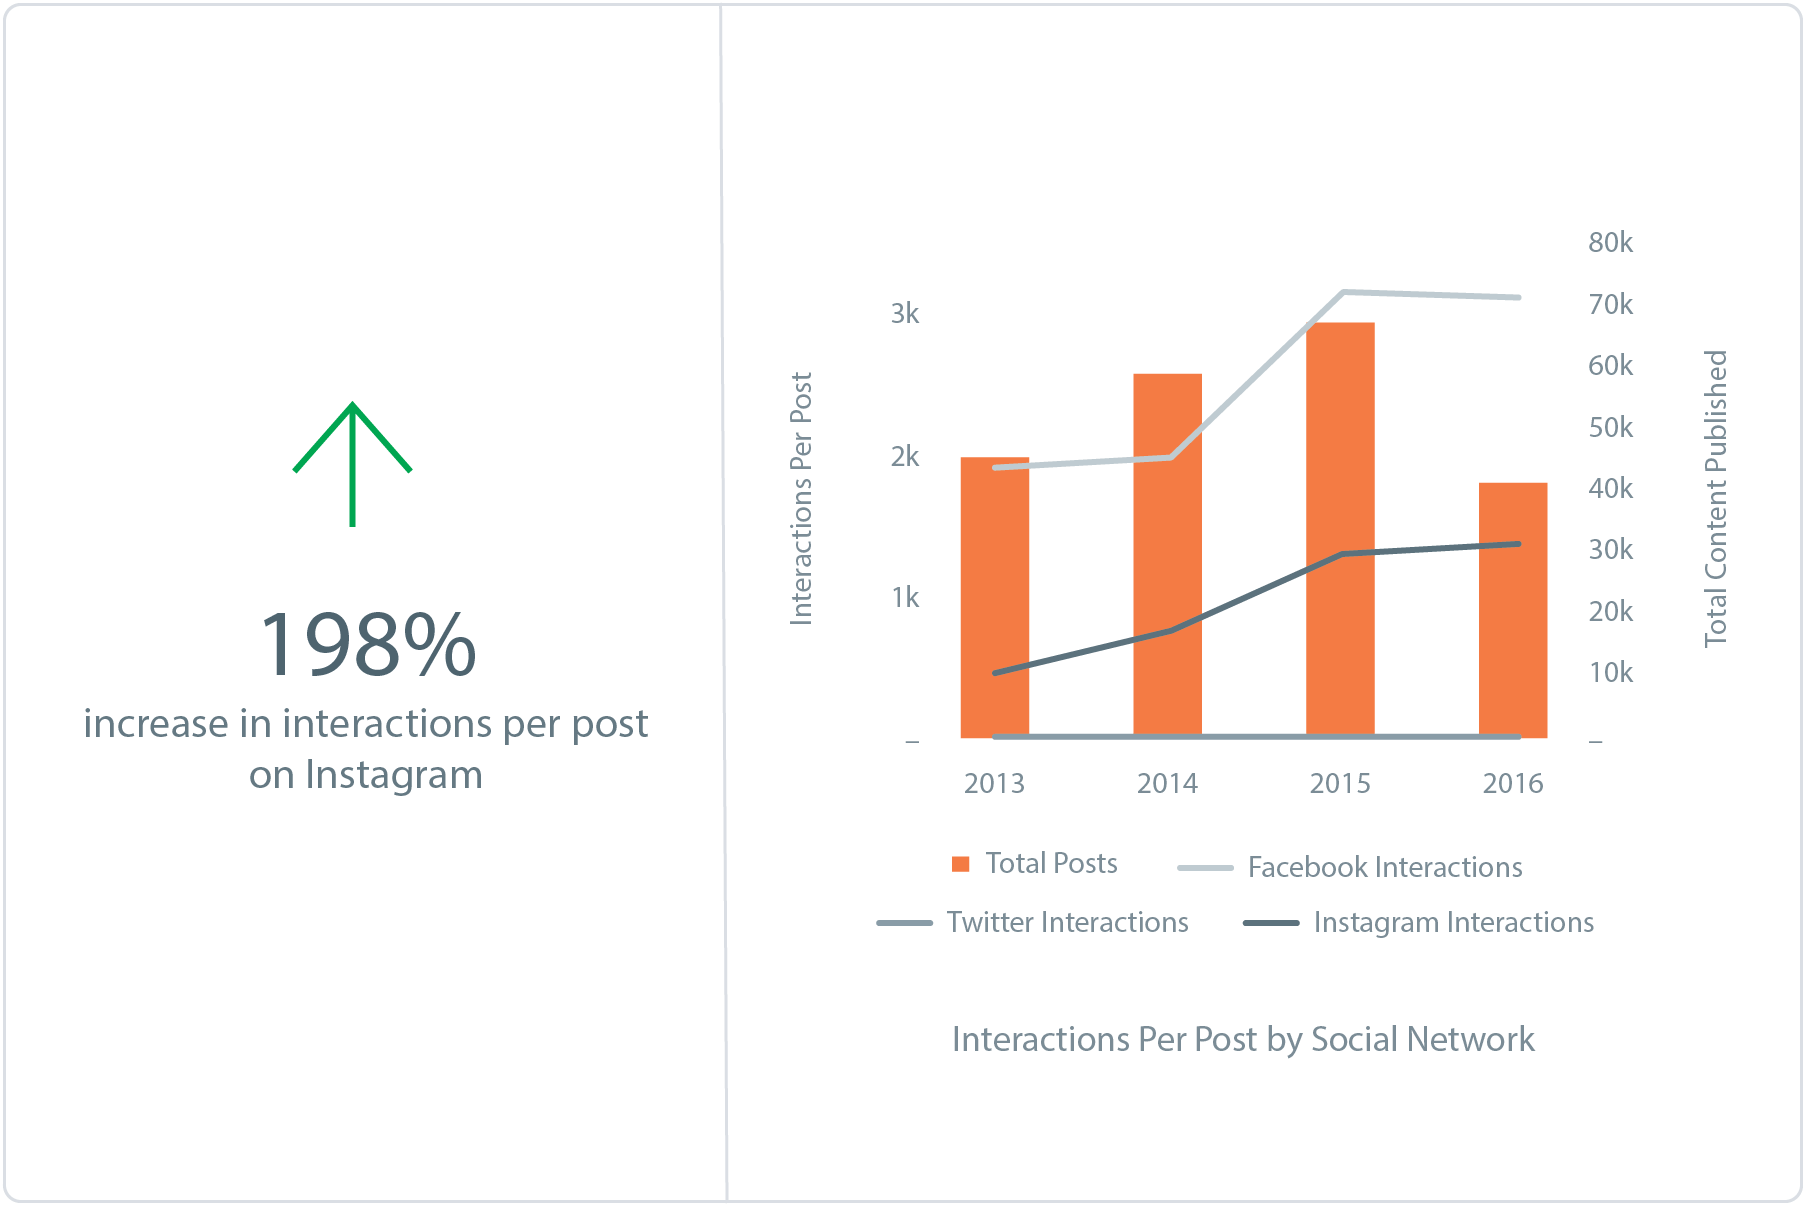
While the amount of content published by CPG brands has fallen below 2013 levels, total engagement on brand content has increased signicantly in terms of interactions per post. One of the biggest increases in interactions has been in the number of shares per post on Facebook. In 2013, content generated an average of 108 shares per post. By 2016, this had increased to 506 shares per post. By generating more shares, the reach of the content increases, potentially reducing the need to create more content to achieve the same level of reach. Twitter remains one of the worst places for CPG brands to receive meaningful engagement on its content. This is likely because of the chronological nature of the social network where tweets can be buried in under 15 minutes.
- An influencer outreach campaign on Twitter in April 2016 helped Tide earn over 430 interactions per tweet – 630% higher than the average CPG brand.
- Dawn only published 11 posts in 2016, but its focus on corporate responsibility and how much its product helps wildlife caught in oil spills helped it generate 91,500 interactions per post.
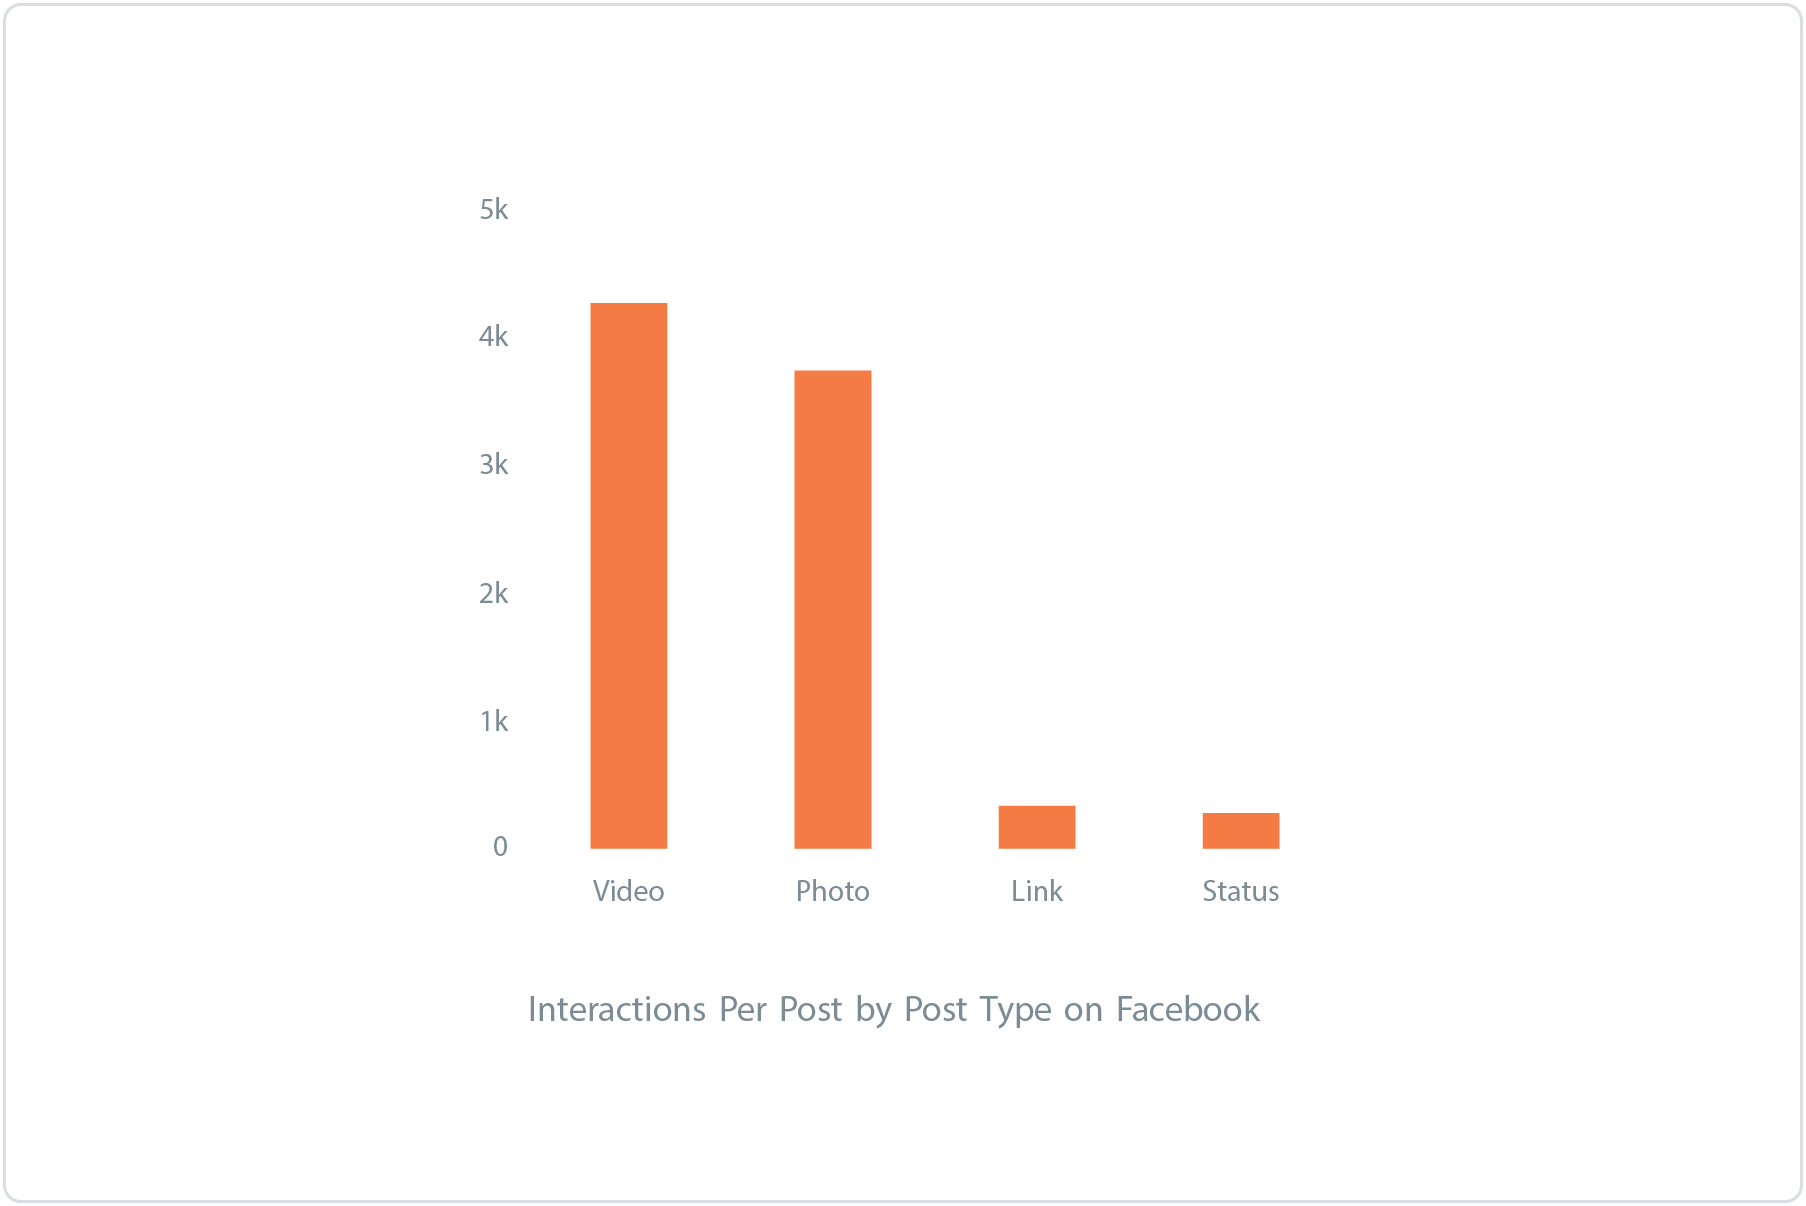
3. Videos Drive the Most Interactions on Facebook
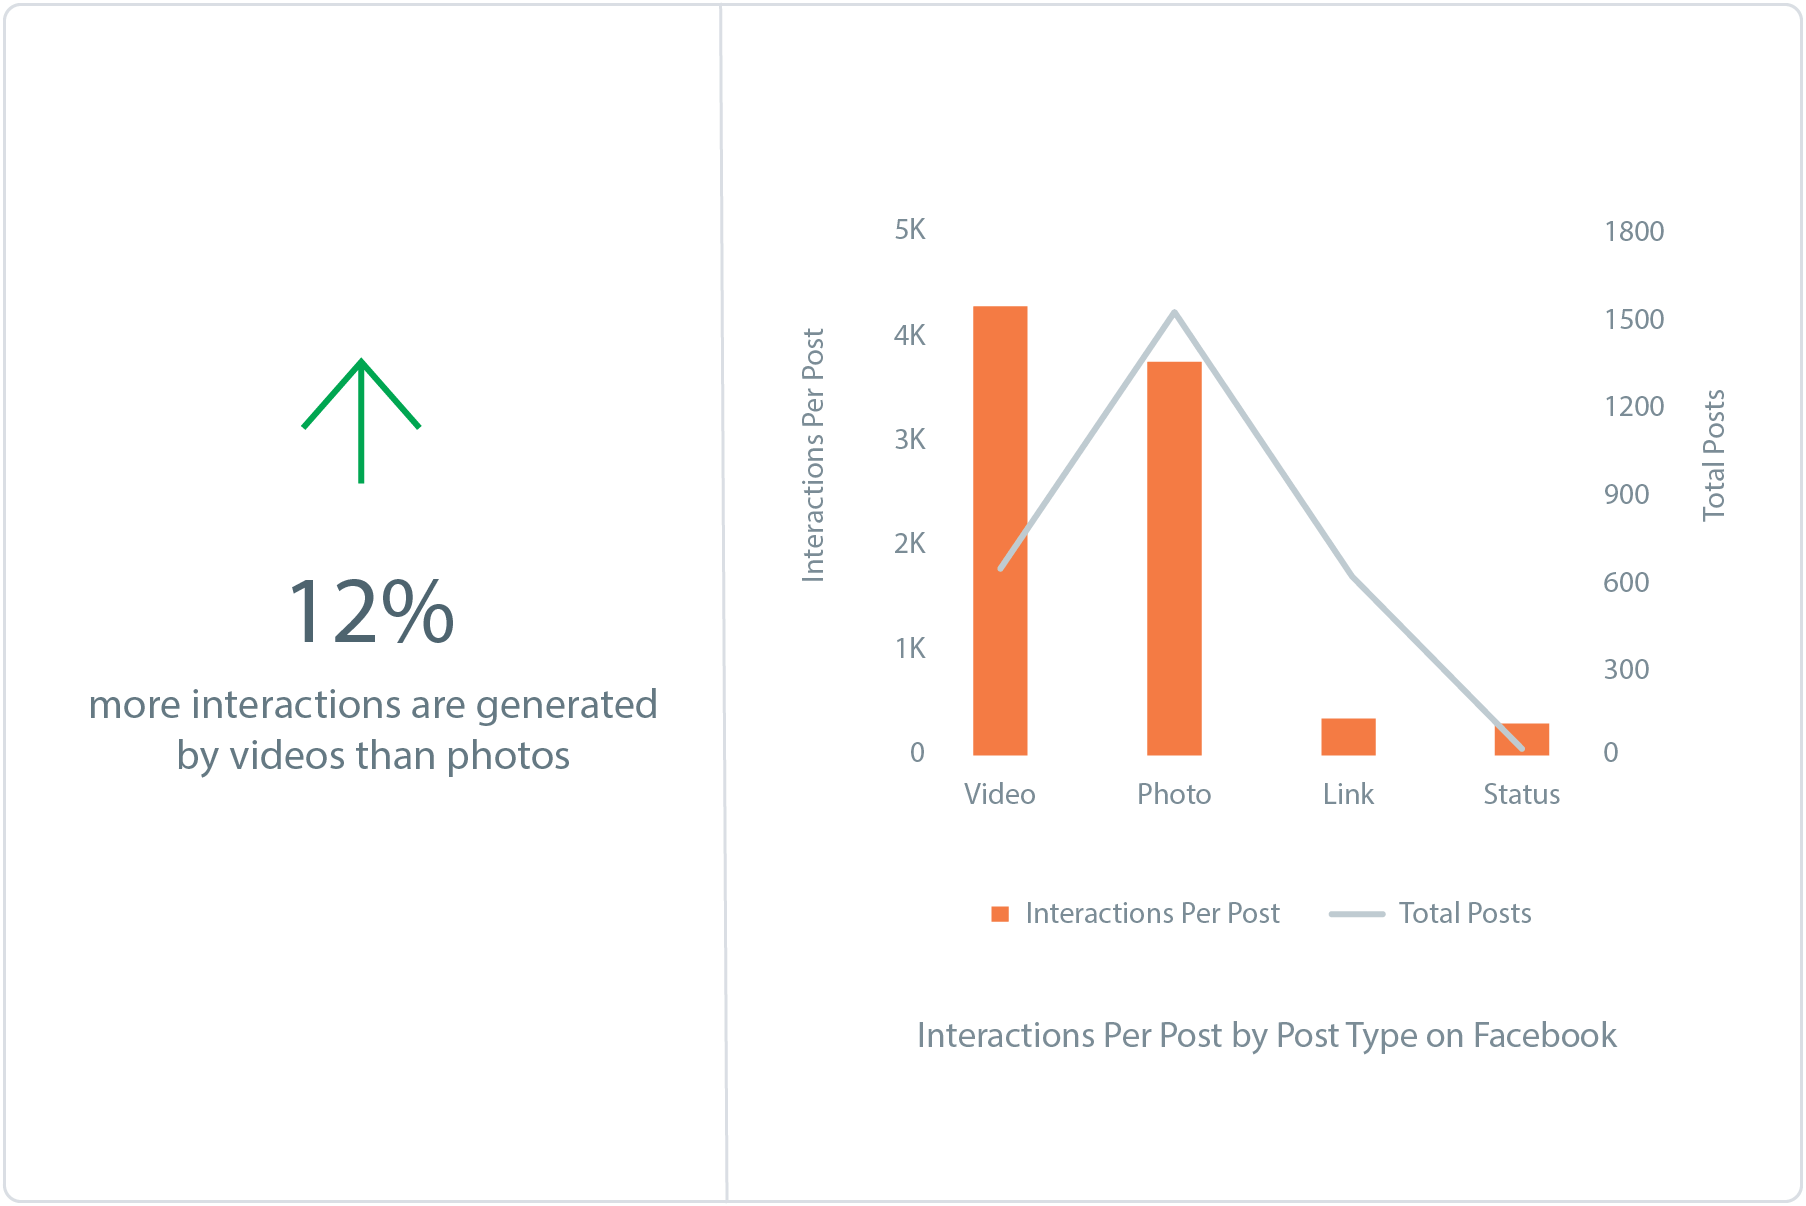
Our studies in the past found that videos were the most engaging content on a Facebook page. Not surprisingly, our recent analysis of the CPG industry found that brands relied on videos to bring in the most interactions and accounted for 32% of the overall content shared on Facebook. However, a deeper analysis showed that brands posted 57% more photos than videos even though videos received more interactions per post (as mentioned before). 24% of video interactions were shares.
- Windex published the most shared video in the CPG sector – a video with 7,594 shares which was about a DIY snowglobe.
- The Honest Company published 73% more videos than the industry average but it only accounted for 11% of all interactions.
4. Promoted Posts Spike in 2H 2016
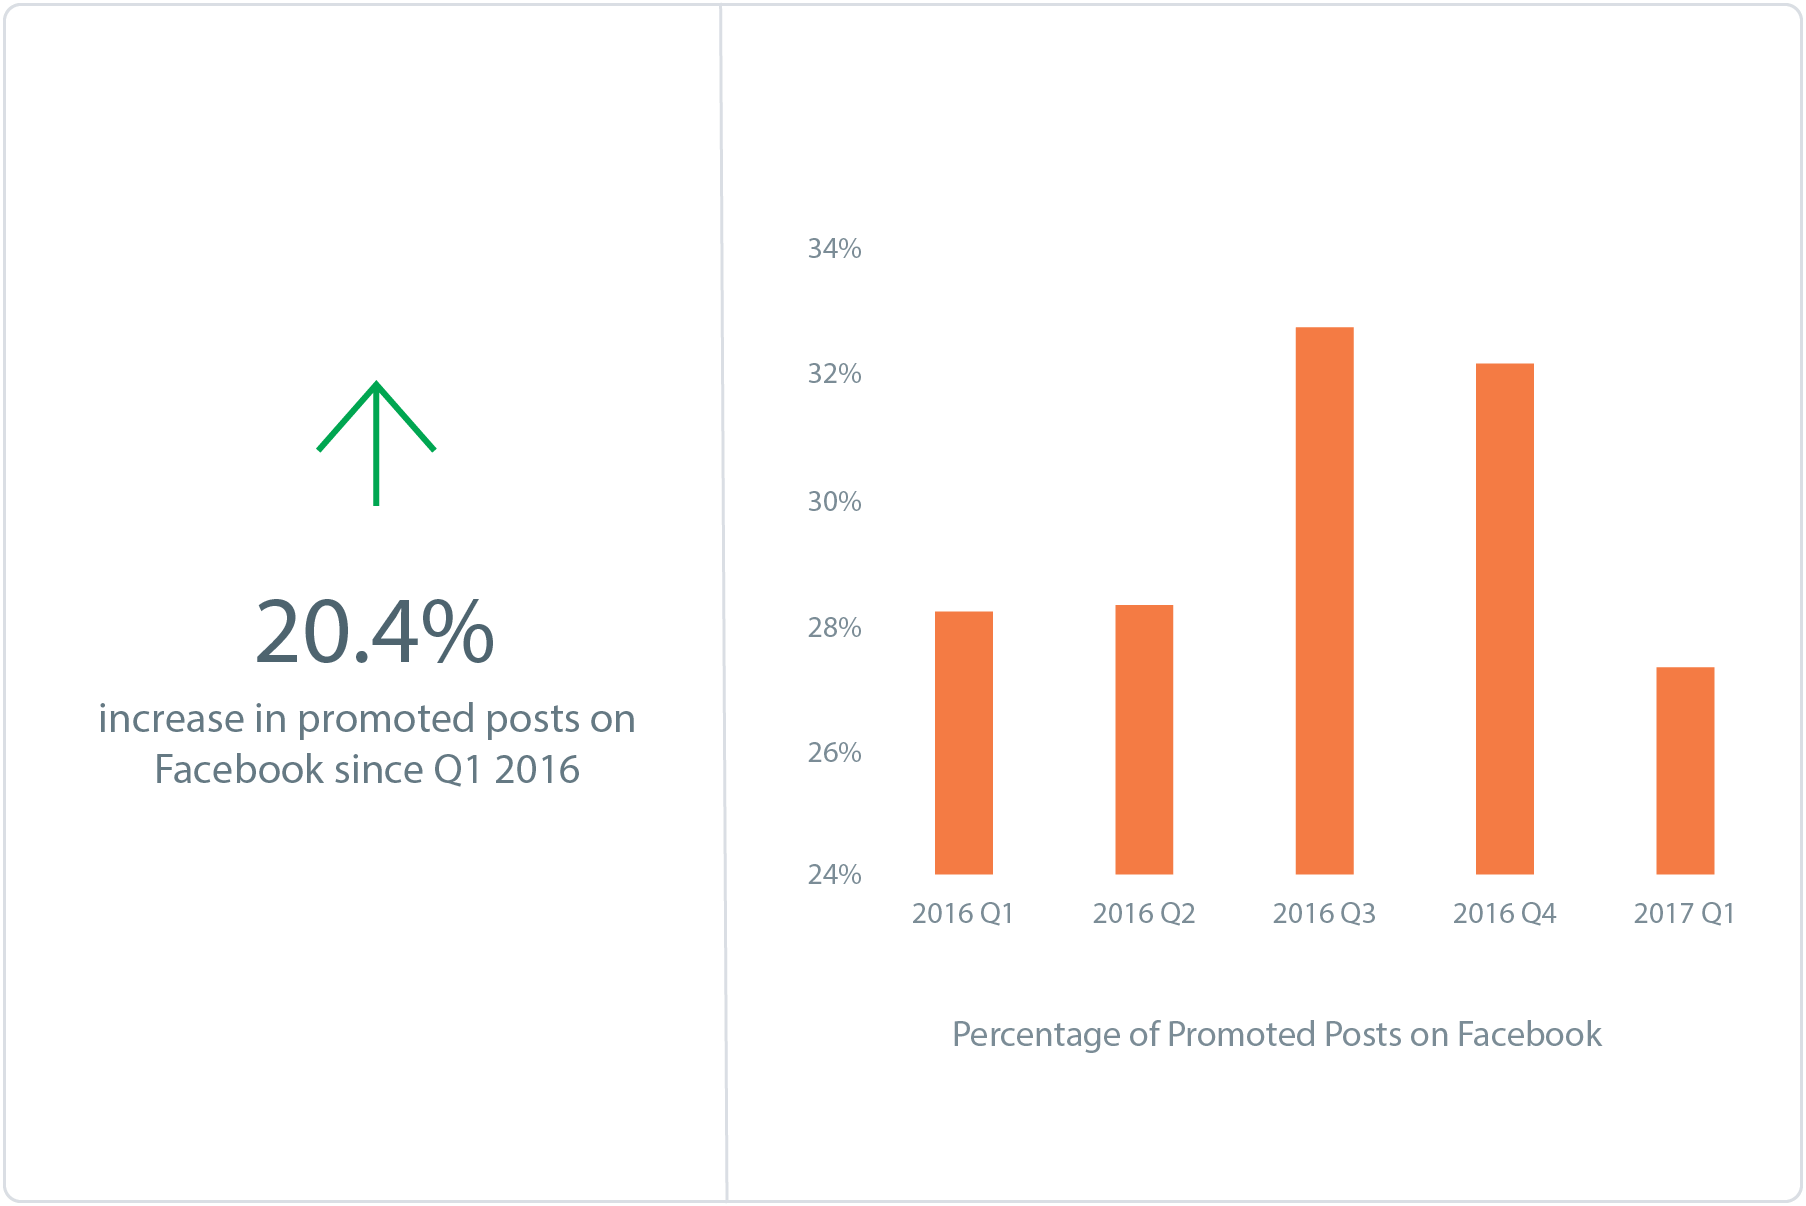
CPG brands in the US promoted an average of 37% of their content between 2016 and Q1 of 2017 and received 1.5 times more interactions per post than they did on their organic content. Of the 802 videos published between Jan 1st, 2016 and March 31st, 2017, 88.5% were promoted. Promoted videos saw an average increase of 926% in interactions as compared to organic content. 60% of photos were promoted and they generated 420% more interactions than organic photos. There were several CPG companies that promoted only 3% of their posts and saw engagement 90% below the industry average.
- Method promoted 95% of their posts throughout 2016. 94% of their interactions were likes whereas only 3% were shares.
- Lysol had the highest increase in engagement when they promoted their posts. Even though average interactions went up by 3,754%, the number of shares they received per post decreased by 4.5%.
5. Brands Scale Back Twitter Customer Service
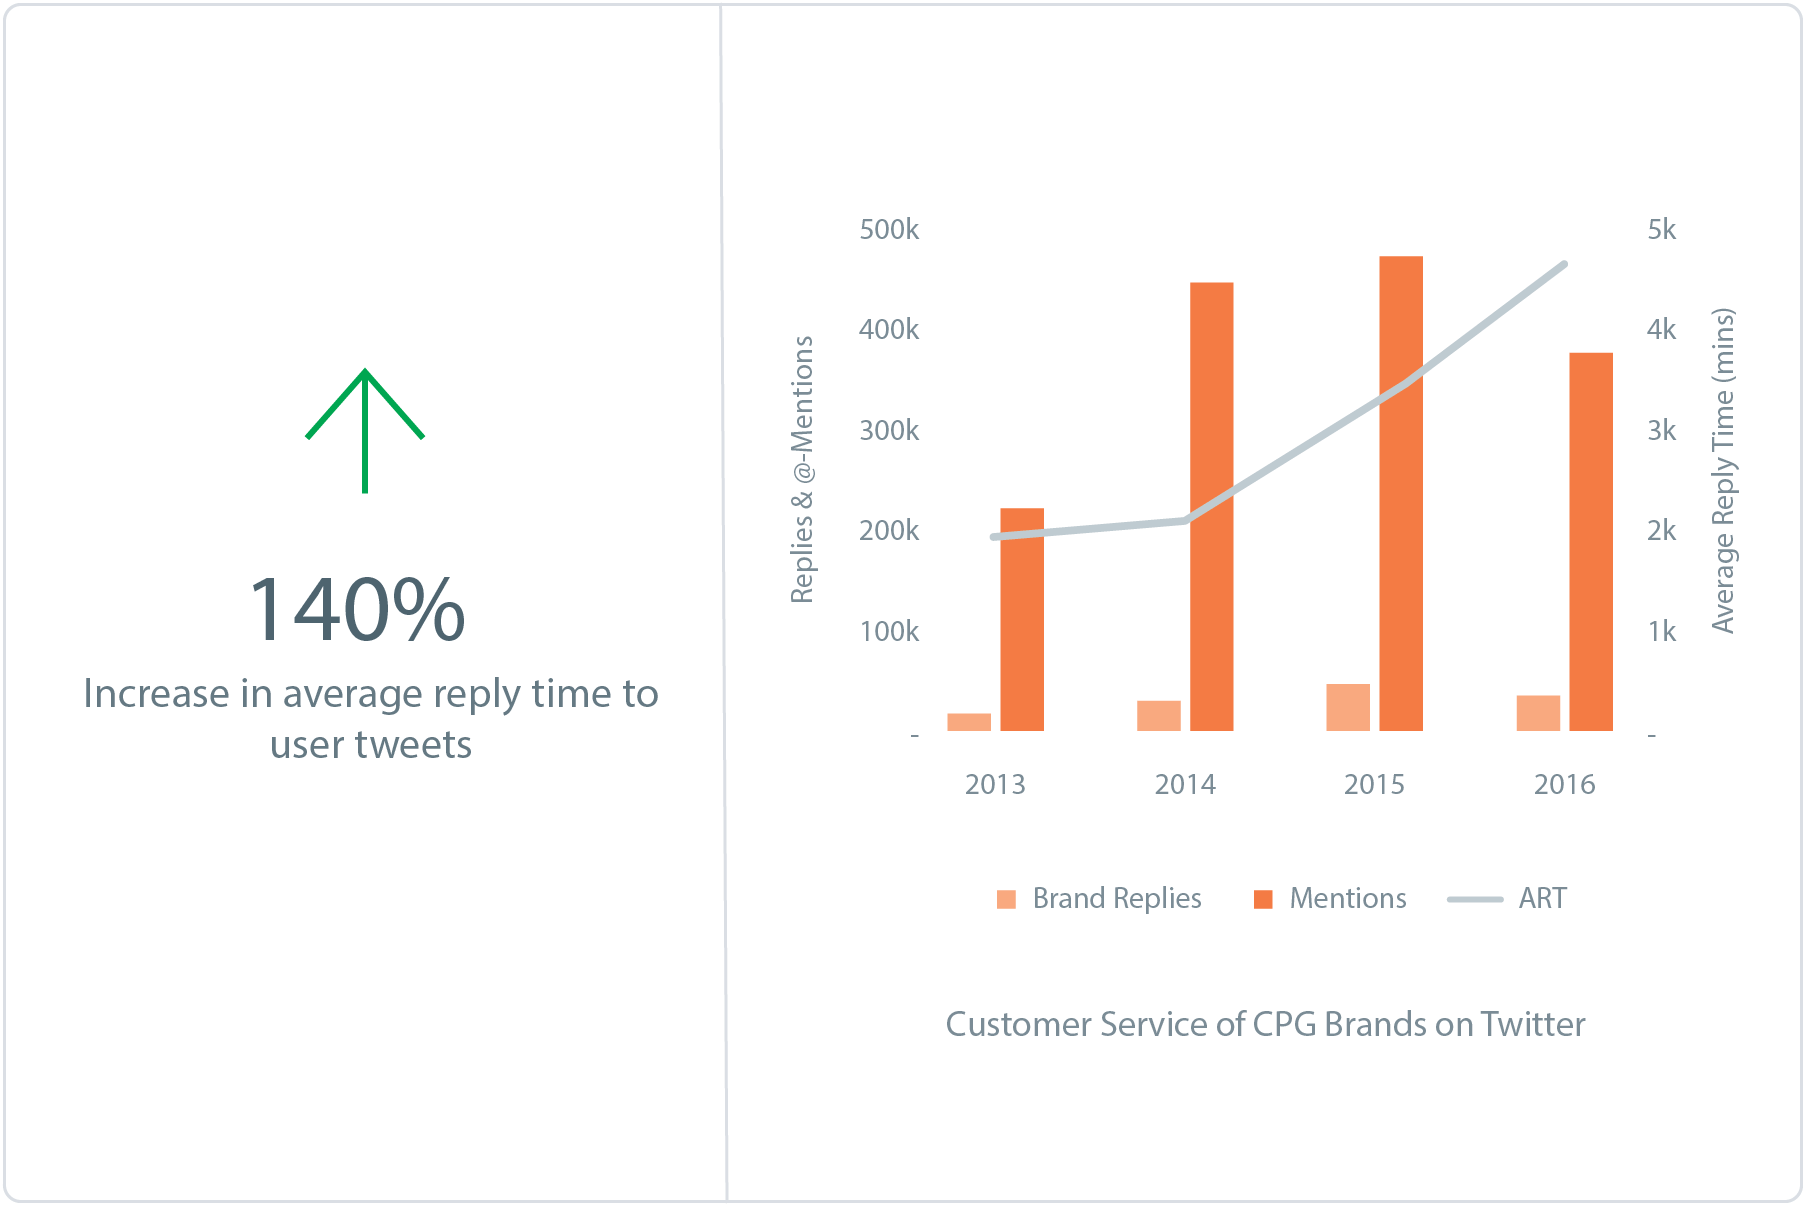
CPG brands fielded more than 361,000 @-mentions on Twitter in 2016, an increase of 70% since 2013 (213,000) but it has dropped from 2015. Consumers turn to Twitter to get questions about product usage, failed expectations and complaints answered by the brand. Addressing this need, the CPG brands in this report replied to over 32,000 tweets. This means that nearly 90% of consumer tweets went unanswered. While Twitter may not be a source of high engagement, it’s a place where people are demanding answers from the brands they use. However, given that brands replied to fewer tweets than in 2015, took longer to reply and received fewer user mentions, they should carefully consider their investment in this platform.
- Harry’s had the highest number of replies (5,310) and response rates (43% of user mentions were replied to) but also one of the longest reply times. Users had to wait more than one day, on average, for a reply from the brand.
- Kleenex had one of the fastest response times, replying to over 2,300 tweets in an average of 80 minutes. Charmin had an average reply time of over 15 days after it responded to users entering a competition 45 days after they had entered.