
7 Social Media Trends in the Sportswear Industry
Does fitness and holiday gluttony mix? We created this report to find out. Sportswear brands have witnessed a surge in popularity among consumers – often at the expense of traditional apparel brands that have struggled to remain relevant in recent months. Sportswear brands must also join in on consumer conversations throughout the holiday season while remaining true to their brand values.
This report looks at the social media trends in the last quarter (Q4) of each year from 2013 to 2016. The brands included in this report are as follows:
The full list of social media profiles included in this report are as follows:
adidas, adidas Originals, adidas Running, adidas Women, Asics, Converse, Fabletics, Jordan, Just Fab, HEAD Tennis, Lululemon, Outdoor Voices, Nike, Nike Basketball, Nike Court, Nike Football, Nike Sportswear, Nike+ Run Club, NikeWomen, PUMA, PUMA Football, PUMA Running, Reebok, Reebok Classic, Reebok Training, Reebok Women, Under Armour, Under Armour Football, Under Armour Women, Wilson Tennis.
All data and charts sourced from: Unmetric Social Media Intelligence Platform
Instagram is Dominating Engagement for Sportswear Brands
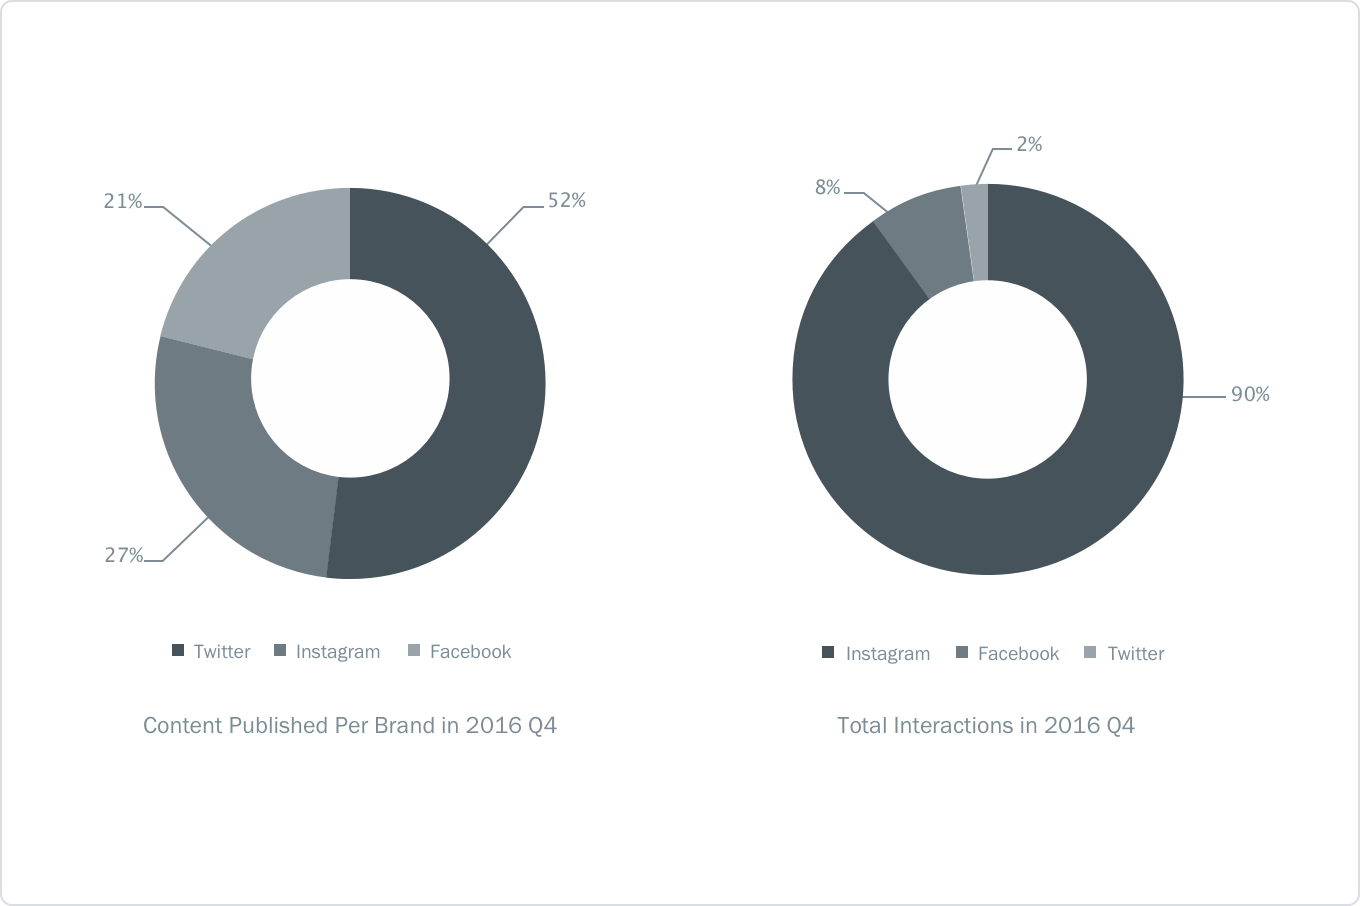
It probably comes as no surprise to anyone working in social media just how important Instagram is for brands. It’s no different for the sportswear industry. A staggering 90% of all user engagement occurs on Instagram. For every user interaction on Facebook, there are 9.45 interactions on Instagram. It’s not just user likes; posts on Instagram get twice as many user comments compared to Facebook.
Your Emojis Are Not Bringing You Better Engagement
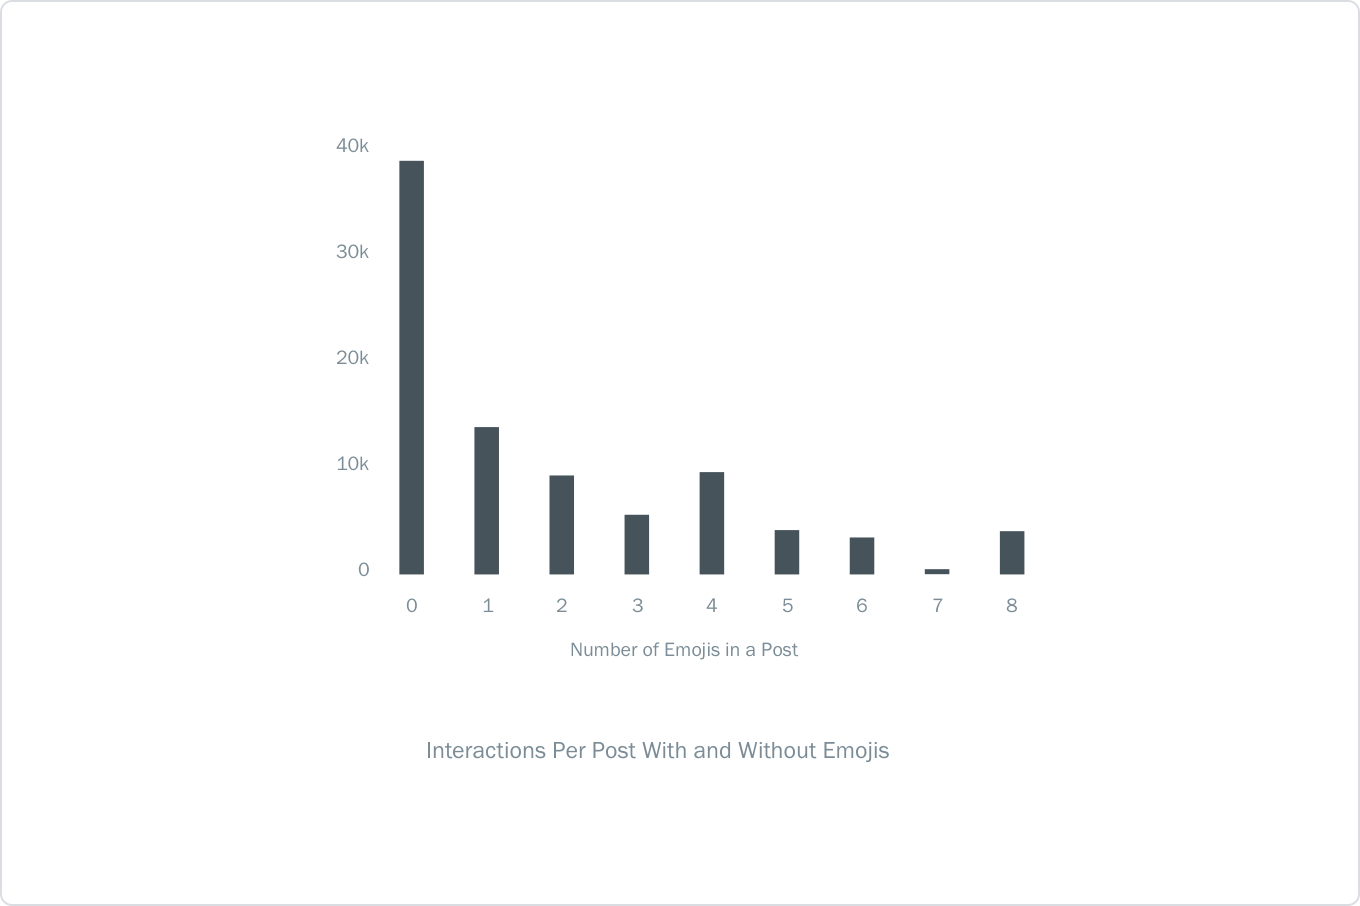
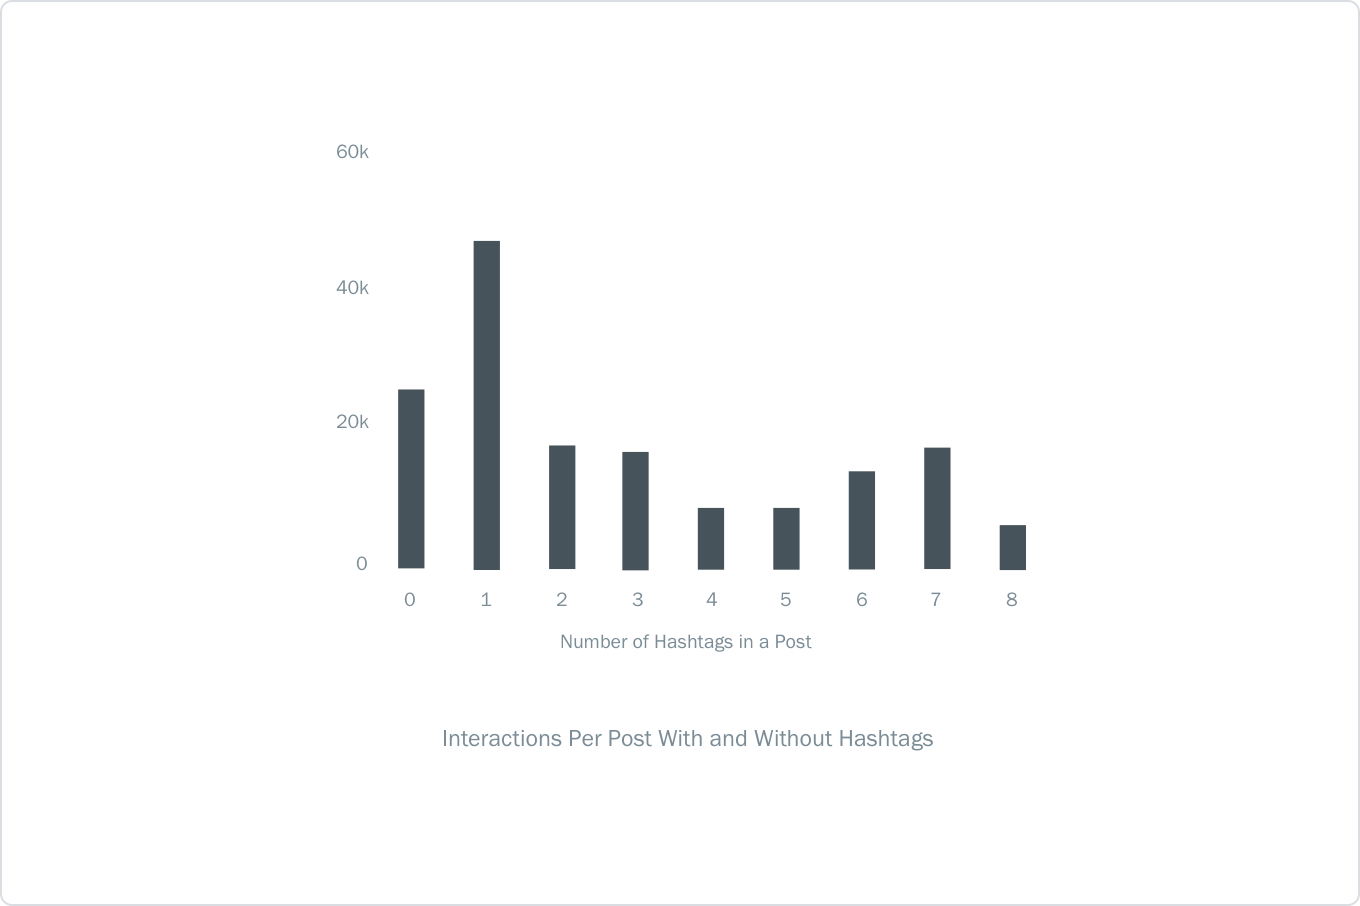
The whole world has gone crazy for emojis, some tech companies have even gone as far as creating animated emojis. However, an analysis of 57 million user interactions on Instagram for the sportswear brands analyzed revealed that posts that contain emojis receive just 30% of the interactions that posts with no emojis get. A single hashtag, on the other hand, increases your user interactions on Instagram by 80%. Any more than one hashtag in a post and you start seeing diminishing returns.
What Are Sportswear & Retail Brands Talking About on Social Media?
To answer this question, we used the Unmetric Discover product, a searchable database of over 500,000,000 pieces of brand content that have been published over the last five years. The four most popular topics in Q4 of 2016 are as follows:
NEW COLLECTION
684 Brand Mentions
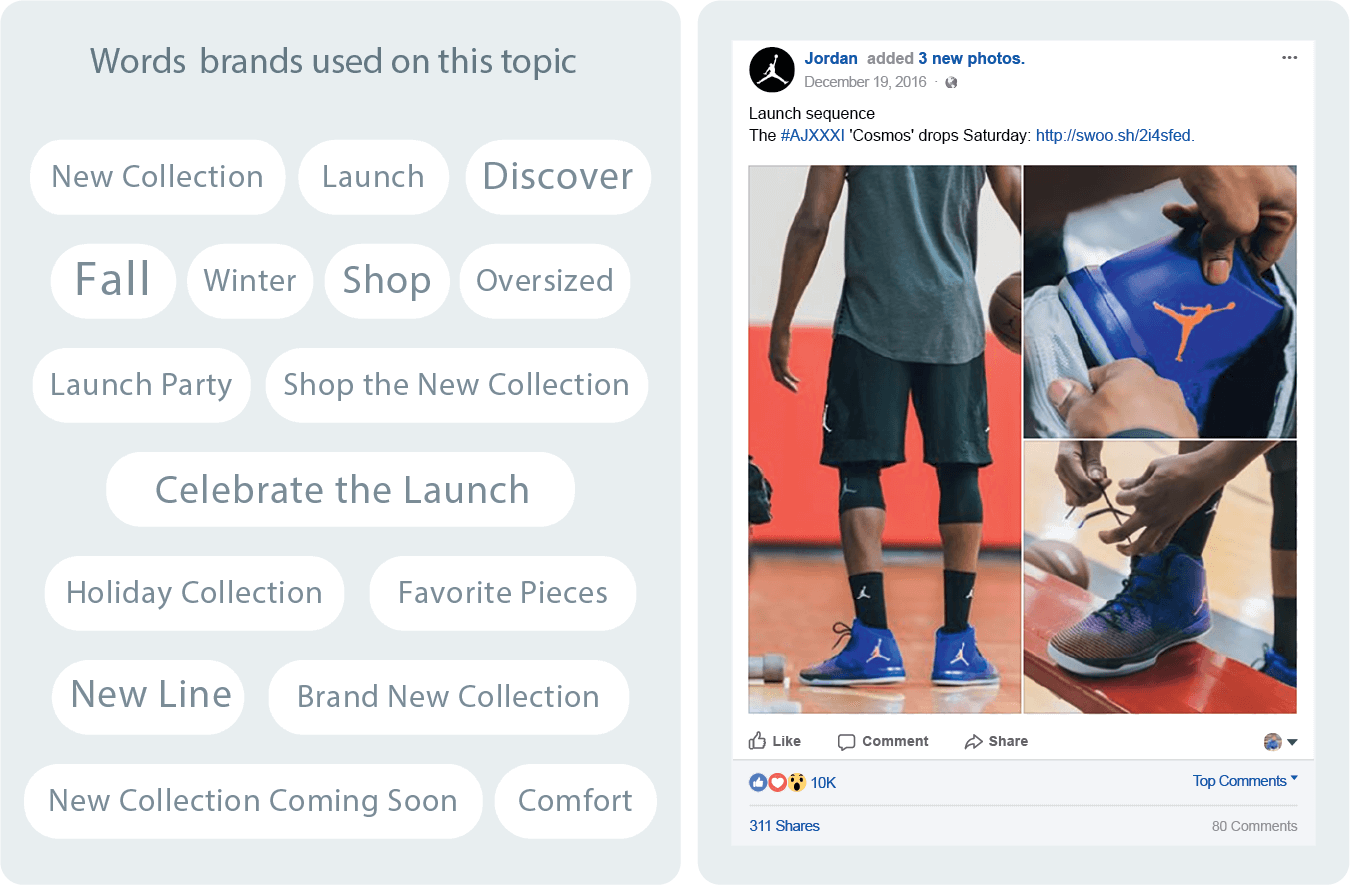
One of the most engaging topics for sportswear brands is the launch of their new collections. All brands see the highest engagement in this content bucket. Jordan received over 10,000 likes on its organic post about its new sneakers.
FITNESS
1,544 Brand Mentions
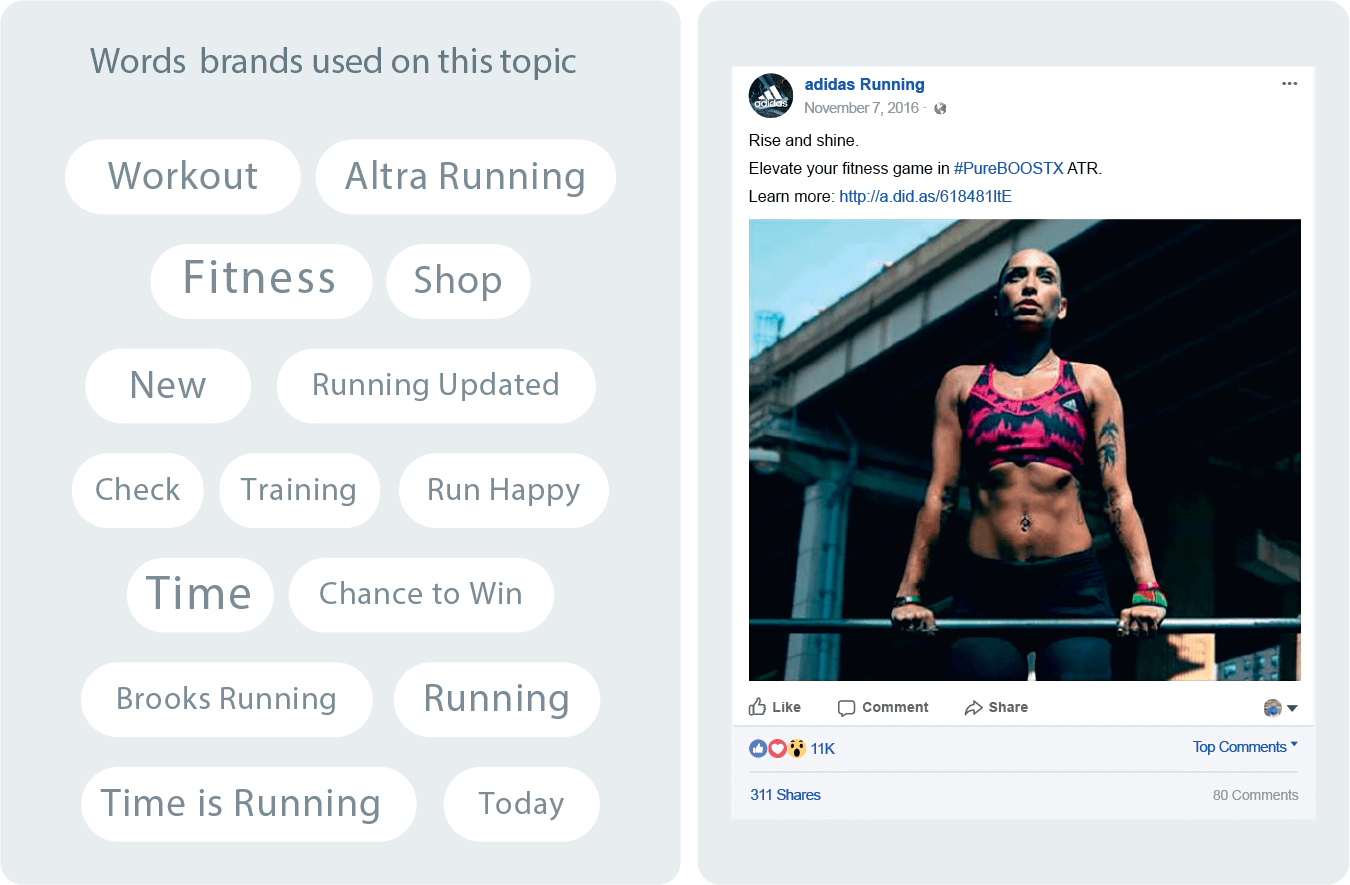
Unsurprisingly, fitness, training and running played a pivotal role in the content strategy of sportswear brands. Many of these types of posts needed a paid push to receive the engagement they did, like this one from adidas Running which was the most liked post about fitness.
Besides the staple topics for sportswear brands like fitness, health and new collections, holidays and seasons also play an important role in their content strategy.
HOLIDAYS
14,280 Brand Mentions
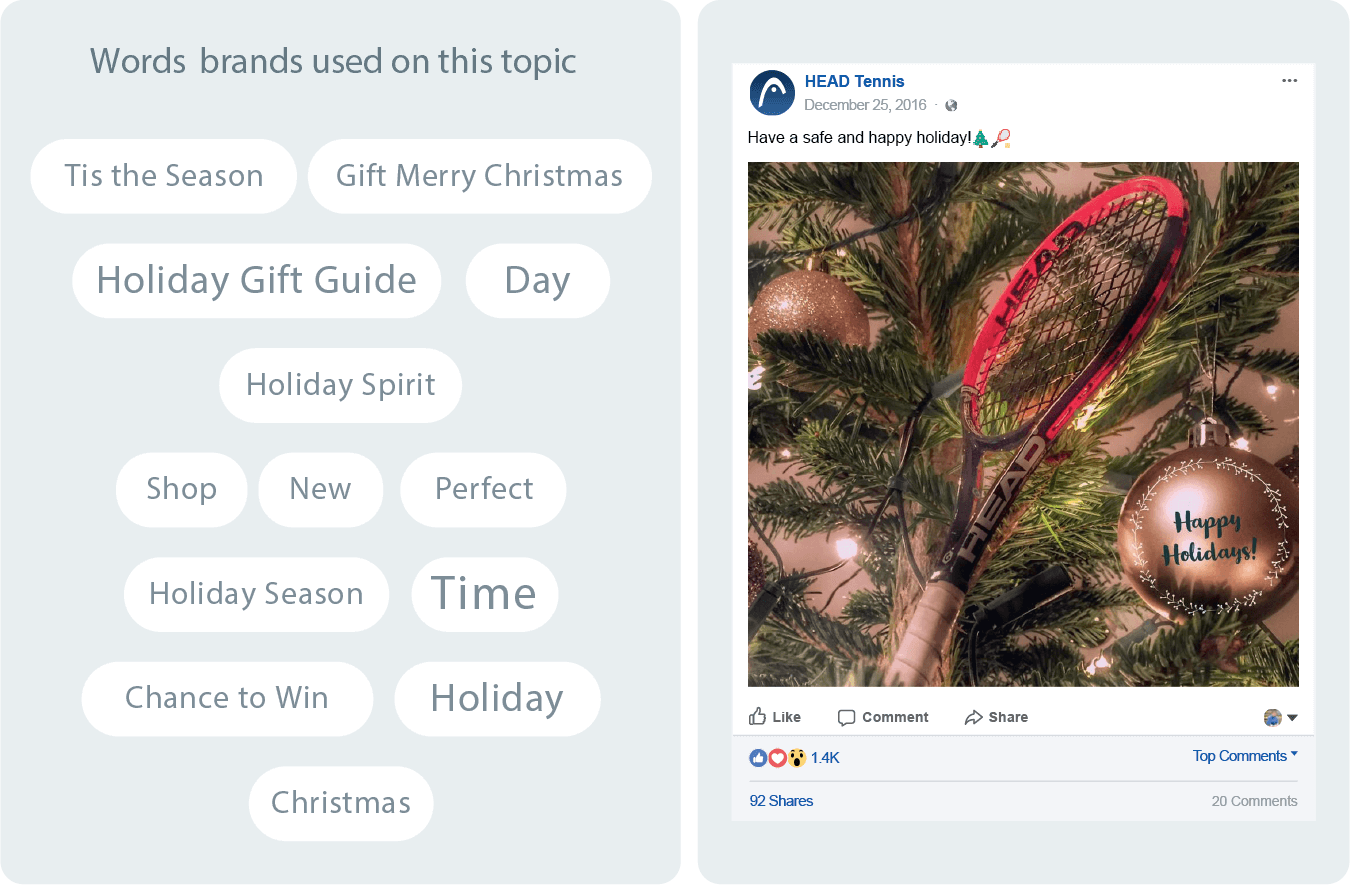
For many retail brands, the holiday season is the most important time of the year. While that may be the case for sportswear brands as well, it didn’t engage with fans as well as other content buckets. This holiday greeting post by HEAD Tennis was one of the most engaging.
WINTER
3,945 Brand Mentions
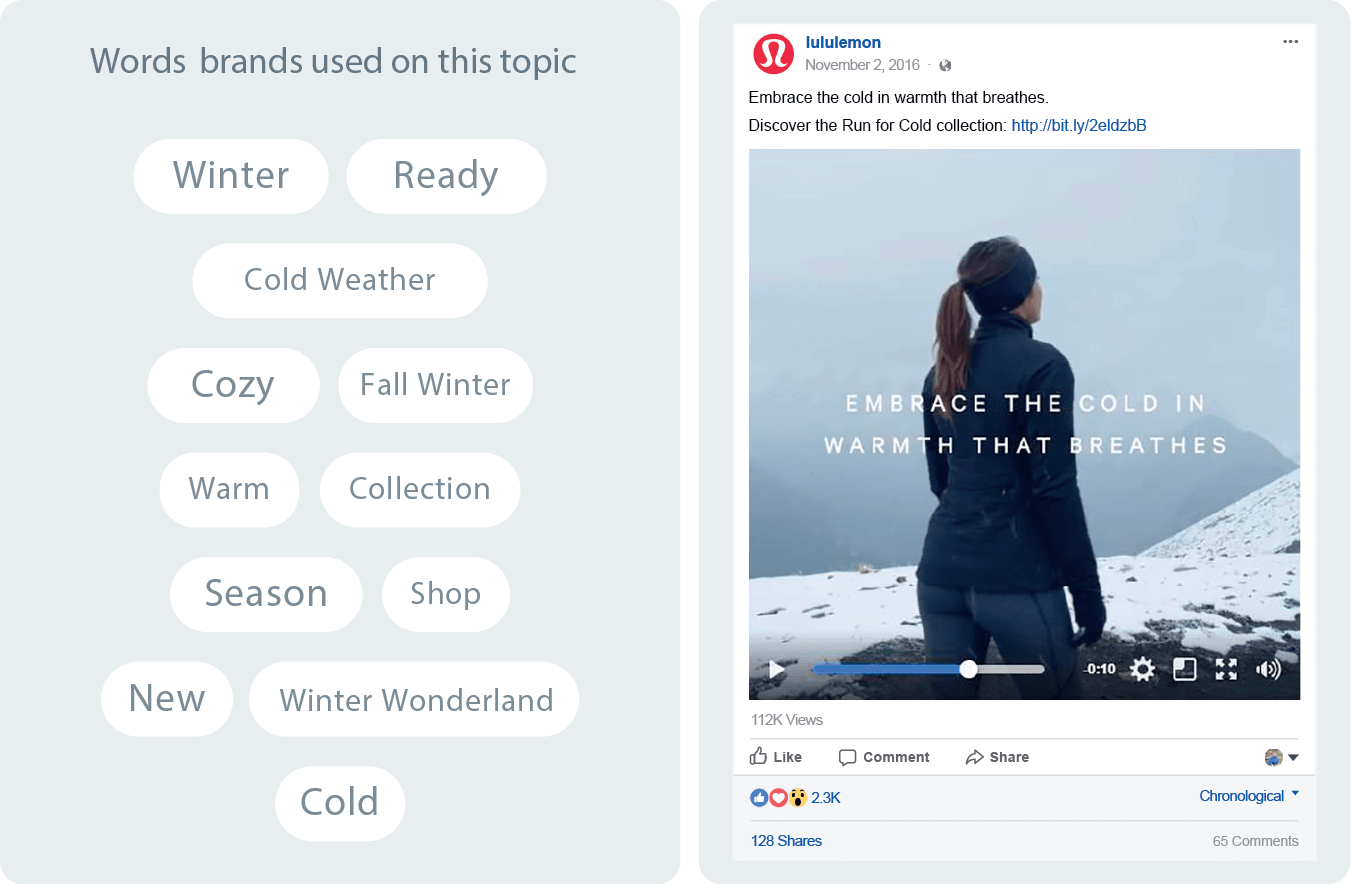
Many sportswear brands took the opportunity to tell people how their warm clothing will help during the winter months. This video from Lululemon had over 112,000 views and let women know that they didn’t have to layer up to continue running.
Trends
7 Holiday Trends Impacting Sportswear Brands on Social Media
1. Total Content Published Has Fallen Year on Year
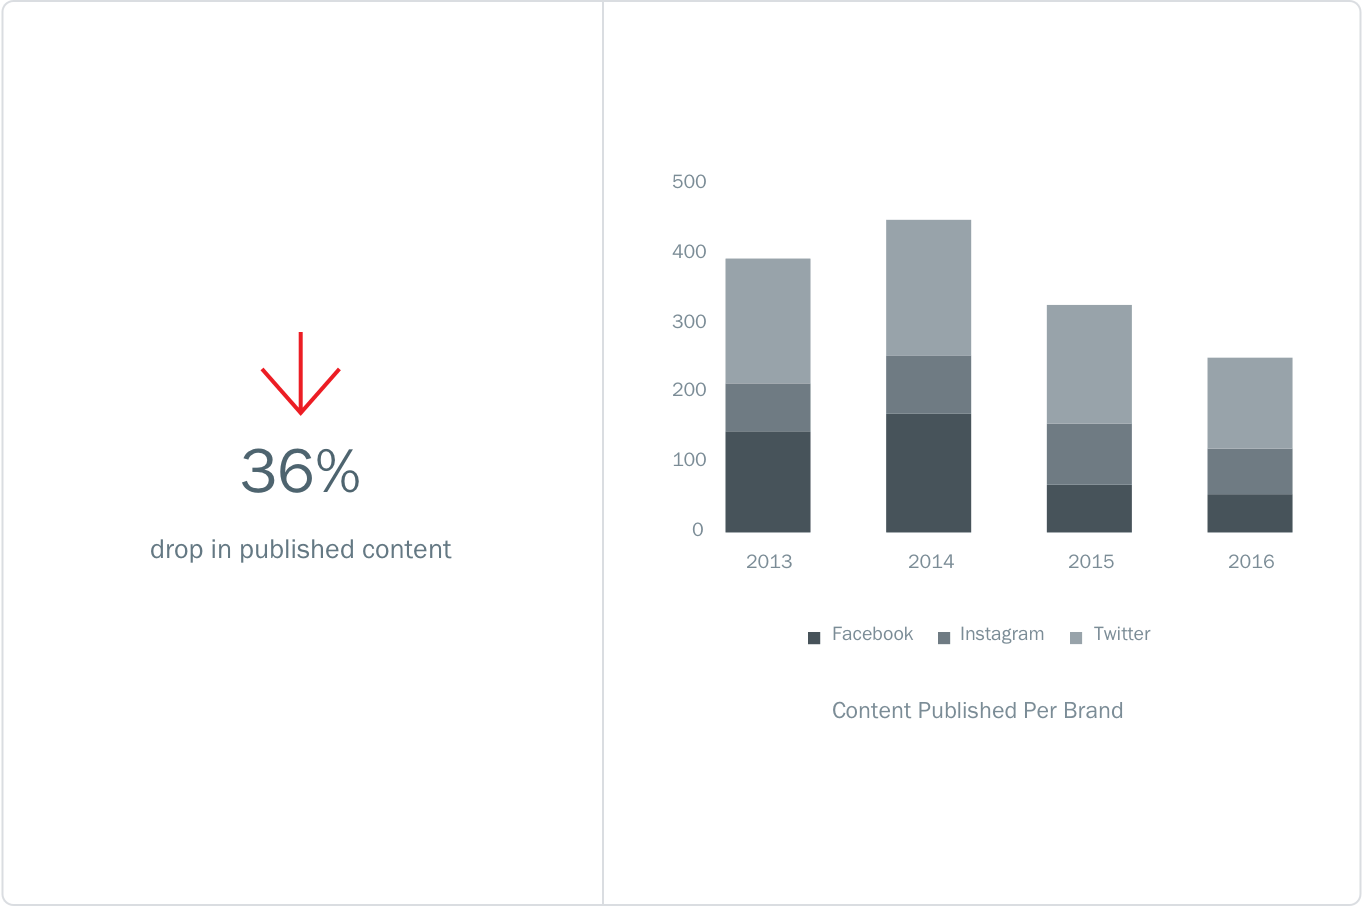
Content published on social networks by sportswear brands in Q4 has fallen year on year since 2014. This drop has been most pronounced on Facebook where brands published 63% less content in Q4 of 2016 than they did in Q4 of 2013. This study does not take into account ‘dark posts’ on Facebook as this data is not available from Facebook’s API. Instagram has not been as badly affected by reduced content compared to Facebook, although it did hit its lowest level in 2016. Twitter has also seen a decline in published content (excluding brand replies to user tweets).
- JustFab published 252 posts on Facebook in Q4 of 2016, five times higher than the average sportswear brand
- adidas Originals preferred Instagram over Facebook, publishing nearly six times more content on Instagram compared to Facebook
2. Published Content Drops Between October and December
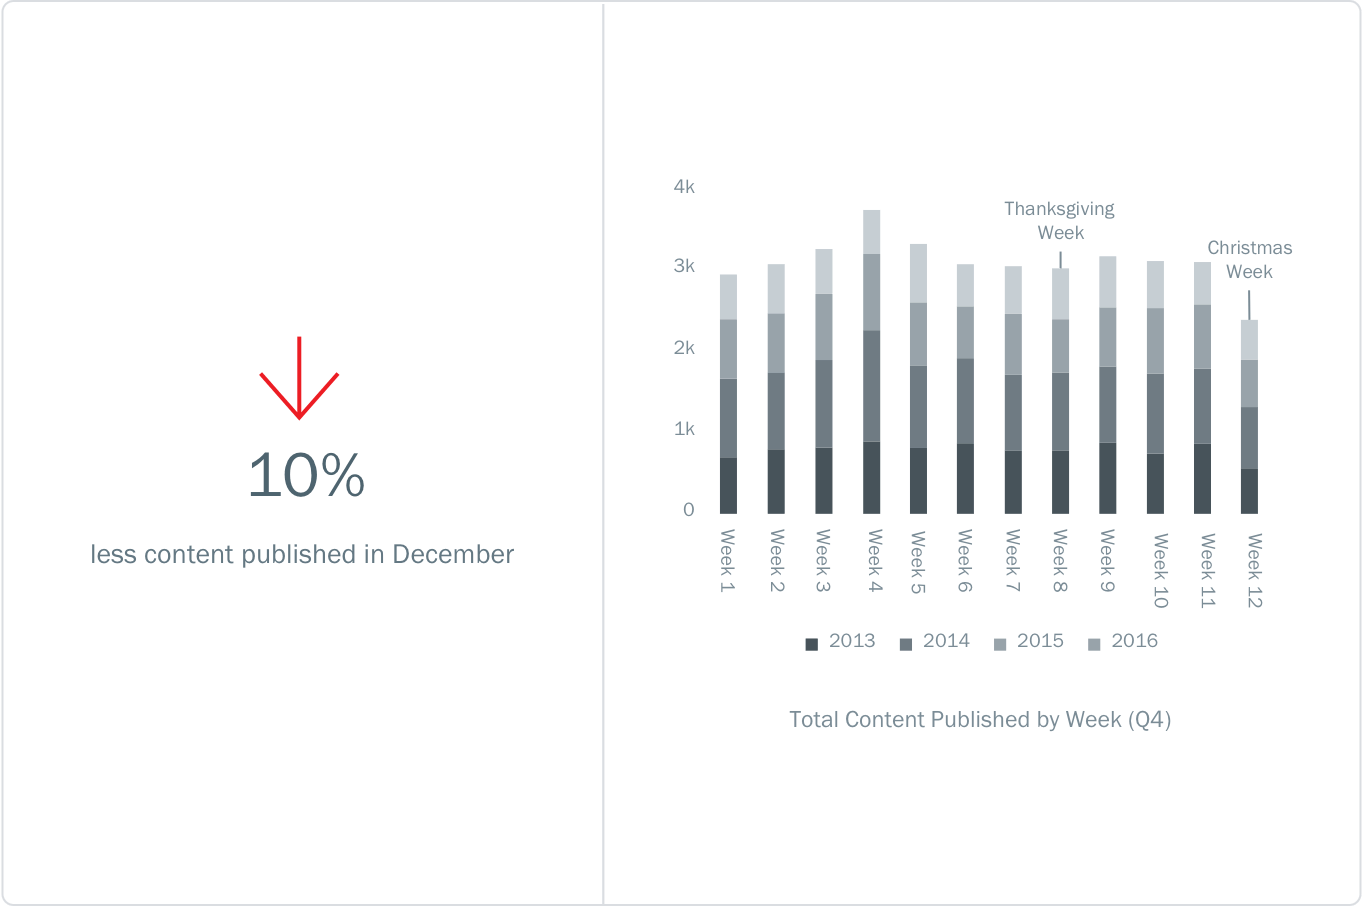
Our initial hypothesis was that published content would increase throughout the holiday season. This turned out to be incorrect as published content actually drops by an average of 10% between October and December. Published content has traditionally peaked in the last week of October and first week of November. It remains relatively stable until the last week of December when it reduces considerably. Christmas Day saw the least amount of content published by brands, but in terms of interactions per post, it was one of the best days to publish content in the quarter.
- Lululemon was one of the few brands that increased the content it published in December. It published 83% more content in December than in October
- Although total interactions fell by 20% between October and December, Nike Basketball bucked the trend and increased its user interactions by 55% in the same period
3. Most Facebook Post Promotion Happens in November
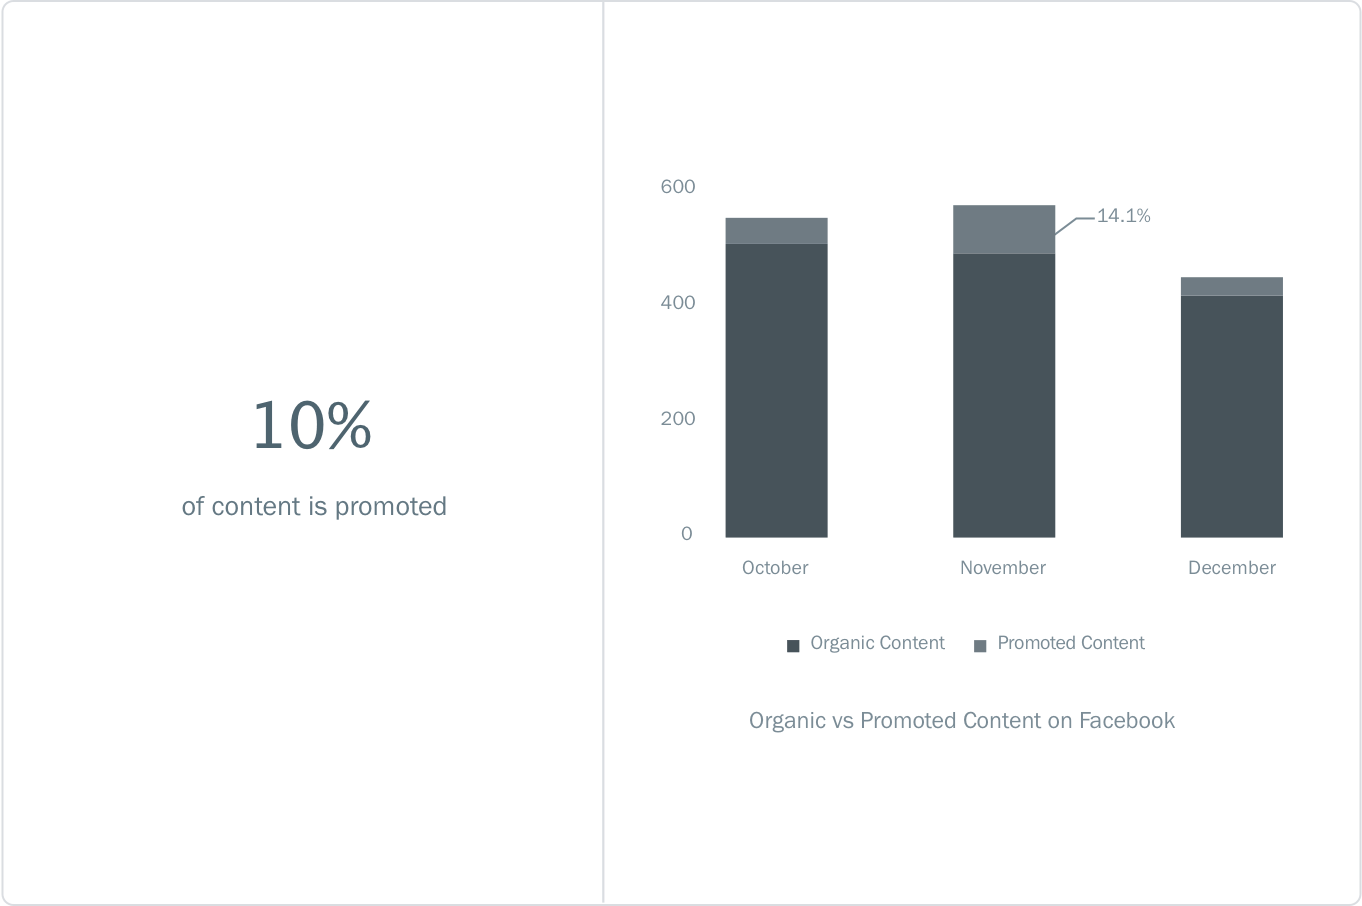
Sportswear brands were only promoting 10% of their public Facebook content between October and December 2016. It is possible that these brands published more ‘dark posts’, which are not publicly accessible via Facebook’s API, and so has not been taken into account here. Of all the promoted content in 2016 Q4, 51% is published in November, 28% in October and 21% in December. Promoted content on Facebook received four times more interactions than non-promoted content.
- Asics published 34 posts on its Facebook page in Q4 of 2016. 82% of those posts were promoted — the highest by any brand
- Reebok Women promoted 12 out of the 66 posts it published on Facebook. Its promoted posts saw 54,545% higher engagement than its non-promoted posts
4. Christmas Starts in December — But Few People Care
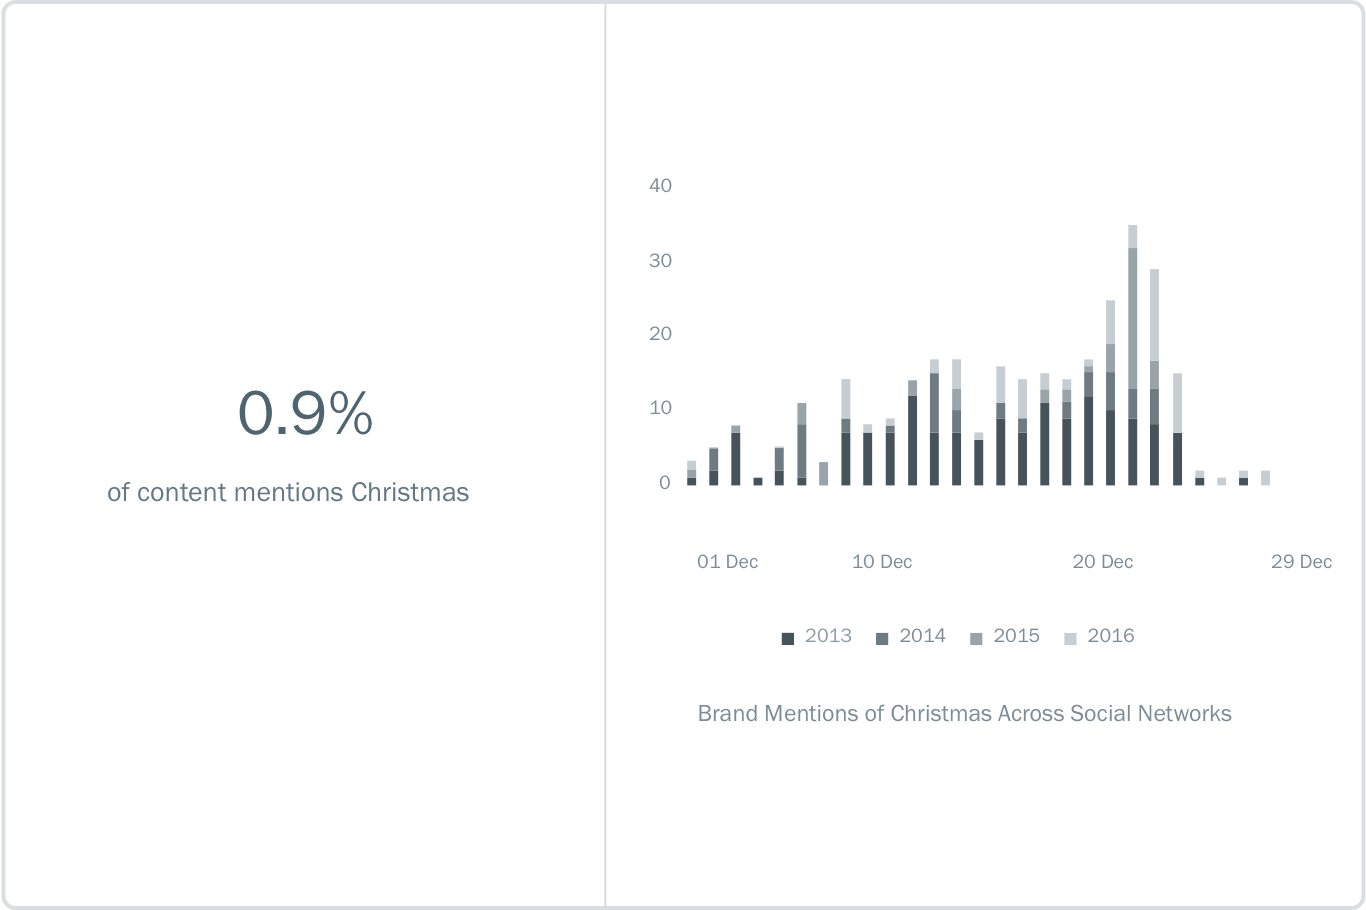
Holiday campaigns by brands get a lot of people talking about it. To tap into this conversation opportunity, brands have started their Christmas campaigns earlier than in past years. To see if this holds true for sportswear brands, we looked at when they first mentioned Christmas each year. What we found was, barring one or two ironic posts about Christmas, most brands start their campaign from 1st December. In 2016, 37% of all Christmas content was published in the five days before Christmas day. It was found that in 2016, Christmas content on Instagram saw 21,400 interactions per post, whereas the average for all content was 31,400. Engagement for Christmas content on Facebook and Twitter was also lower than average.
- JustFab posted the most number of times about Christmas in 2016 with 18 posts. Wilson Tennis wasn’t far behind with 17 posts
- Jordan won Christmas in terms of engagement. It generated more than 153,000 interactions, or 38,000 interactions per post on its Christmas content
5. Holiday Content Starts in November
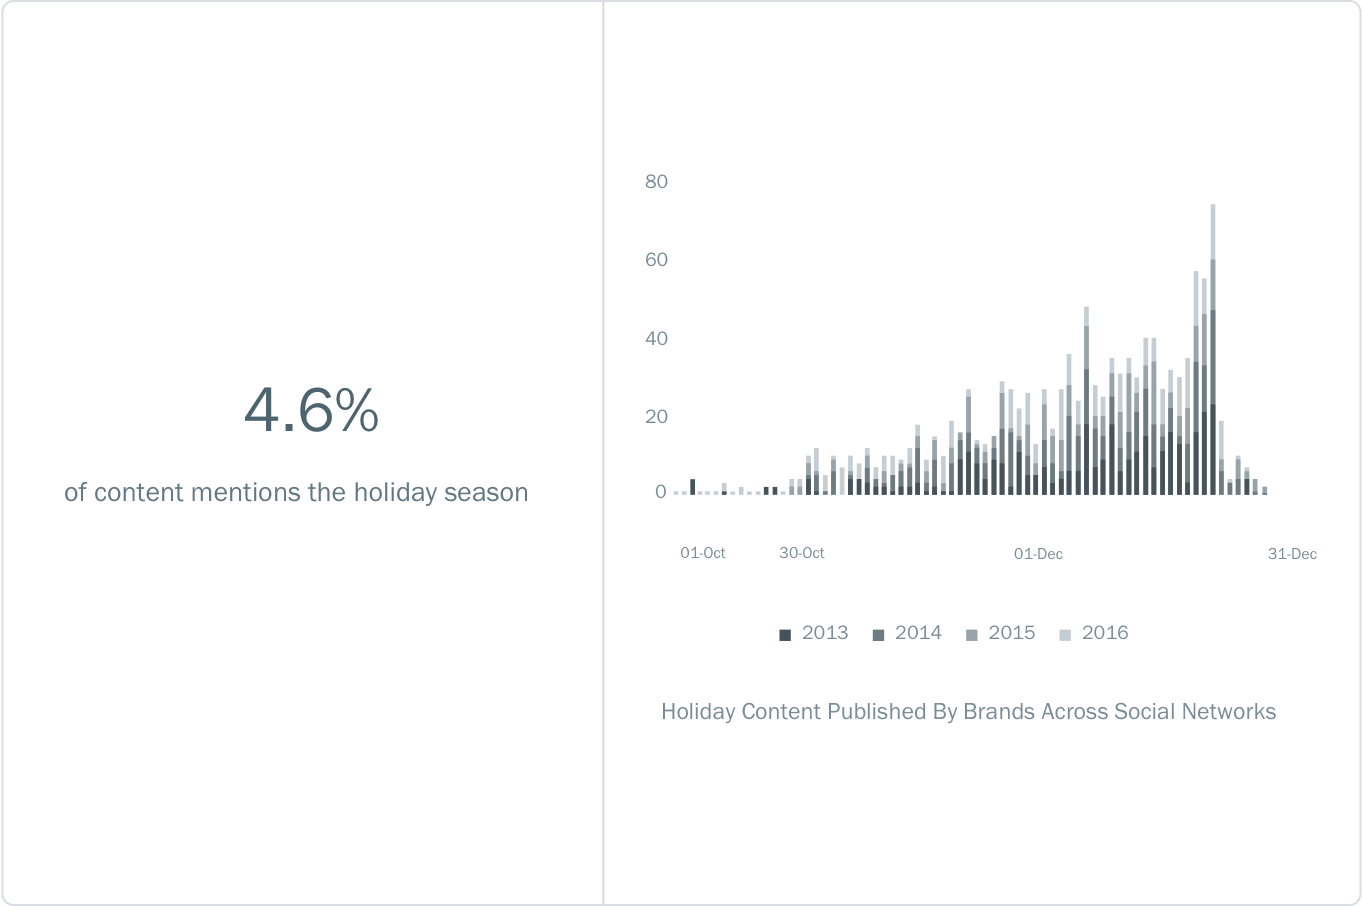
For sportswear brands, the holiday season starts in earnest from November. Holiday content increases week on week until it peaks on Christmas Day. This suggests that brands are far more comfortable talking about the holidays in general than Christmas in particular. As with Christmas-based content, brands receive lower engagement on holiday content than average. On Instagram in 2016, holiday content generated 15,245 interactions per post, even lower than their Christmas content. Facebook fared even worse, receiving 1,289 interactions per post. After December 25th, mentions of the holiday falls significantly with a few brands talking about the sportswear gifts the audience may have received.
- Fabletics won the share of voice around holiday content with its 89 posts. This was 30% of the total brand mentions of the holidays
- adidas Originals dominated engagement around the holidays. Its 11 holiday posts generated 807,000 user interactions. This was 61% of the total user interactions around the holidays
6. Interactions Per Post Have Grown Each Year
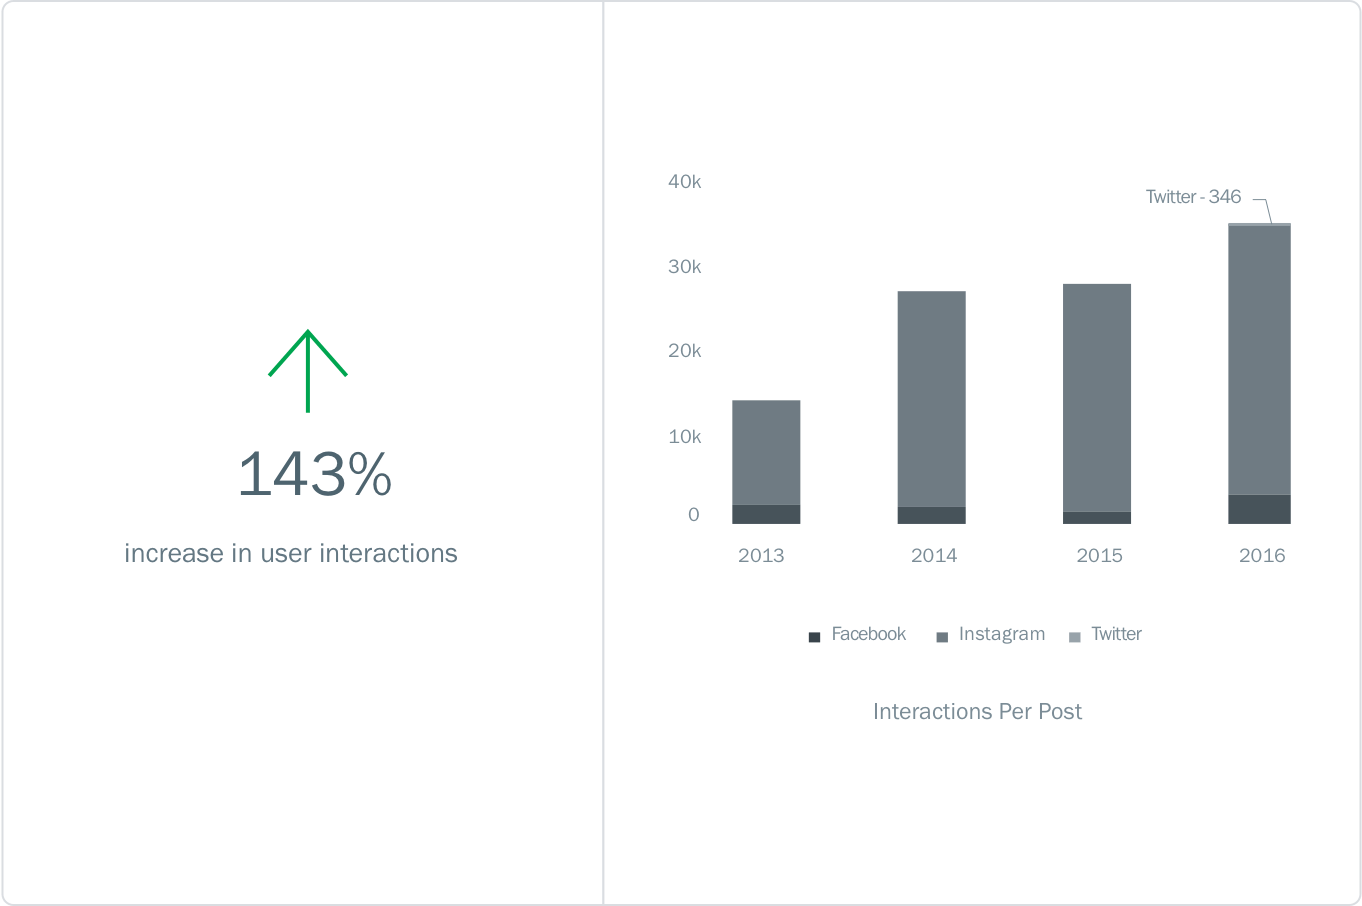
Despite far less content being published, sportswear brands appear to have doubled down on the content that users love. Interactions per post have grown by 143% since 2013. While some of this could be attributed to larger audience sizes, it could also be the result of paid promotions across all three social networks. Even though organic reach is at an all-time low on Facebook, sportswear brands have managed to increase the interactions per post by 44% since 2013. Although Twitter user interactions are a drop in the ocean compared to the other social networks, brands have increased interactions per tweet by 202% since 2013.
- adidas Originals earned 30% of total user interactions across all brands in Q4 of 2016 with 19.3 million interactions on its 152 posts
- Nike didn’t post frequently but it really made its content count, garnering 128,000 user interactions per post on its 46 posts
7. Video Content Has Increased and Creates More Engagement
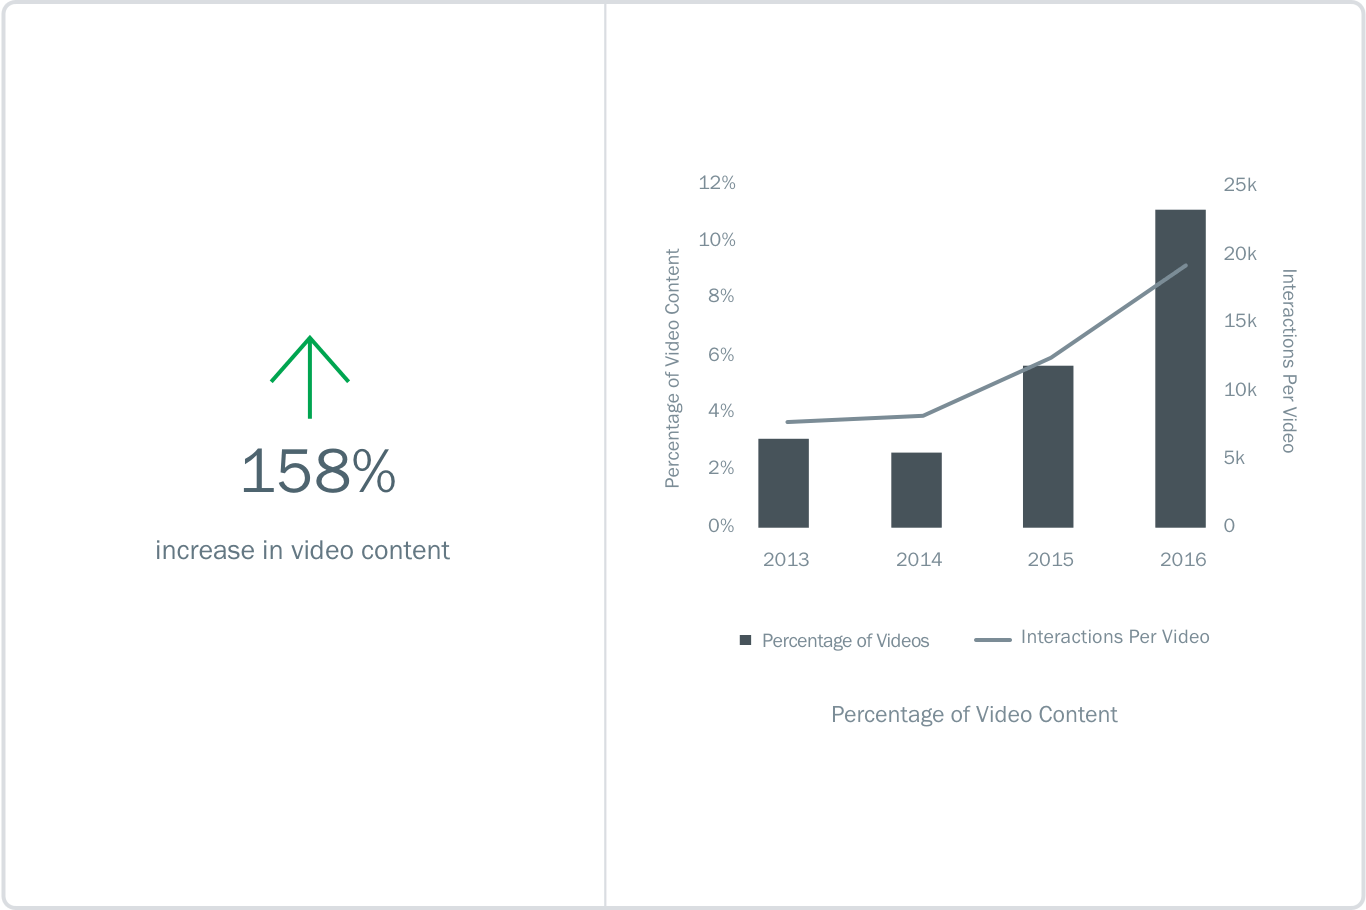
It’s no secret that for brands to get engagement, they need to make video an integral part of their content strategy. In 2013, just 3.1% of all brand content were videos. In 2016, this has risen to 11.1% and looks set to rise even further. In 2016, this 11.1% was responsible for 25% of all user interactions (excluding video views). On Facebook, video content generated 63% more interactions per post than photos, while on Instagram videos fared better by 36% compared to photos.
- As a percentage of its total content, Nike produced the most videos. 54% of its content were videos which accounted for 82% of its total interactions
- Fabletics published four times more videos than the average sportswear brand which accounted for 29% of its total interactions