4 Social Media Benchmarks You Can Use
The problem with social media, according to many marketers, is that everything is so, well, fuzzy. Many businesses around the world are still struggling to put firm figures on social media ROI whereas a handful of brands like Burberry seem to get it and now spend 60% of their marketing budget on digital channels.
One area of social media where you can start pulling out some hard numbers right now is to start benchmarking your own efforts against that of your competitors or even industry as a whole. Benchmarking has been done in every area of business before now but it’s still surprising to hear that many businesses don’t know if their social media efforts are good or bad.
If you are wondering if you, your team or even that hip and cool social media agency (who carry the obligatory MacBooks everywhere they go) that you hired at an exorbitant price are delivering value for money then it’s time to start benchmarking. You don’t even need to be a Harvard mathematics graduate to do it either, just start collecting some data like this…
What’s Your Fan Growth
We’ll start off with an easy benchmark to look at. We know that this benchmark is going to attract some naysayers so let’s preface it with a small caveat: the number of fans you have on Facebook is not overly relevant. However, if you are adding roughly 1,000 new fans each week using legitimate methods how does that compare to your nearest competitors? How does that compare to your sector as a whole?
Don’t be too distracted by the number of fans your or your competitors have but if all your nearest competitors are adding more than 1,000 new fans each week then it’s a sure sign you need to put more effort in to your campaigns.
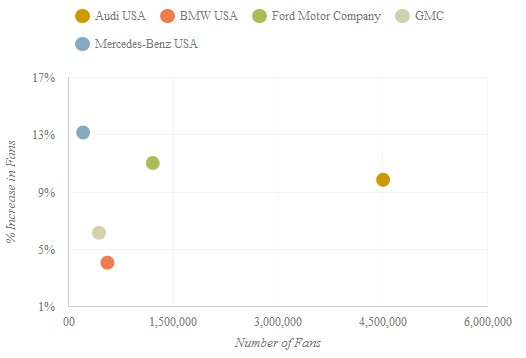
It looks like BMW would do well to take a look at what Mercedes and Ford are doing to achieve such high growth rates because from this small selection of competitors they are well below industry norms.
How Often Are You Posting?
One of the big unknowns on social media is how often are you posting and when are you posting? If you consider Facebook and you are updating your brand page 10 times a day then that’s 10 opportunities that people will see your brand per day but we all know what happens when we get that annoying person who spams our news feed with pointless drivel, a quick unsubscribe or in extreme circumstances an unfriending might be necessary.
On the flip side if you are not posting enough your message and brand doesn’t get as much visibility. This is where benchmarking can come in useful because by looking at your competitors (obviously if you’re in the FMG sector don’t benchmark yourself to any brands outside your sector regardless of how well they might be doing as it would be like comparing apples and oranges) posting schedule you can determine whether you need to doing a few updates each day or if several updates each week would suffice.
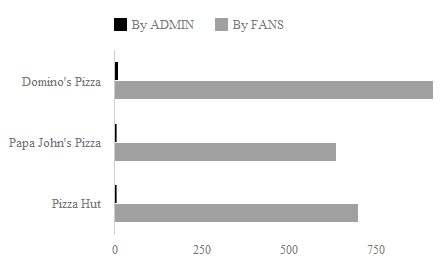
Although the graph is a little bit difficult to make out, Dominos are posting twice as much content to Facebook compared to their rivals and are being rewarded with a higher engagement score.
How Quickly Are You Replying On Twitter?
Twitter is fast becoming the inbound call center of the 21st century and brands like @DellCares and @XBoxSupport are embracing it like never before, infact data from SimpliFlying suggests that providing Twitter support is up to 7 times cheaper than a call center.
Twitter is an instantaneous communication system so if you are not responding to queries as soon as possible you are running the risk of damaging your brand image, losing out on some potential customer evangelism and causing your customers more frustration. So how well is your Twitter efforts compared to everyone else? Are you replying to all valid queries within the hour? Monitor your competitors to get an idea of what their response times are like in order to benchmark your own performance.
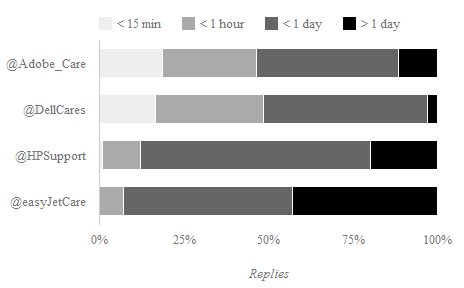
Looking at this chart it seems like Dell are bring their ‘A’ game when it comes to support via Twitter, and it looks like the tech sector in general give far more importance to support than the aviation industry.
Likes, Comments and Shares
Did you recently post some content that generated 30 Likes, 10 comments and 5 shares? That might be good for your page but how well does it compare against your competitors? In a recent survey of 1,500 businesses around the world a massive 54% responded by saying that social media engagement is their priority for 2012. But how can you tell if you are doing a good job or not.
Using the numbers mentioned above, if you are getting 10 comments on content that you are posting, is that good? It might be good for your individual page but what about compared to your industry sector as a whole? Engagement will vary from sector to sector, for example, the hospitality sector has some woeful engagement rates, barely managing more than a handful of likes whereas the aviation industry, which presumably transports the same kind of people, has very good engagement in general.
If you want to improve your social media engagement then you need to start thinking about improving it against what. If you already have above average engagement compared to your competitors and sectors then chances are you’re doing a damn good job and it might be wiser to concentrate efforts on another area of social media.
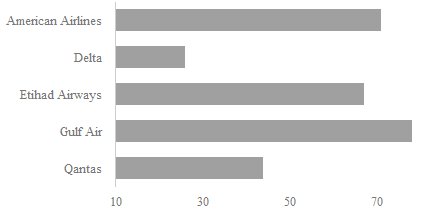
The aviation industry is able to drive really good engagement although it looks like Delta need to work on their social media engagement a lot more because compared to the rest of their industry their engagement scores are well below average.
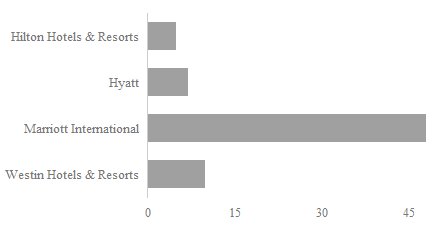
We included this chart because it shows that there is a world of difference between the aviation and hospitality sectors when it comes to engaging customers. We do find this surprising because surely hotels are targeting the same kind of demographics as airlines?
There are a wealth of other data points around which you can benchmark your social media efforts and these 4 methods mentioned should help you get started.
All charts were taken from the Unmetric application. You can start benchmarking your social media performance today by taking a free 15 day trial.


