
Ultimate Facebook Analytics Guide
About this Facebook Analytics Guide
There is a boatload of data being generated on your Facebook Pages every single day, more perhaps than the average page manager knows what to do with. Your Facebook Insights dashboard can give you some rich insights into your audience, their habits and help guide your future strategies.
This ultimate guide to Facebook Analytics breaks down each page within your Facebook Insights page, explains what each chart does, why it’s relevant to you and what insights you might be able to draw from it.
Each Facebook Page has a different goal and no two are going to be the same, but with the use of examples you will learn how to analyze your Insights data better.
If you have any feedback on any part of this article (we would love to hear your feedback!), you can tweet @unmetric
Table of Contents
Facebook Insights Overview
The overview page in your Facebook Insights tab gives you all the high level information your boss or client might ask you. By itself it can’t be said to be very useful, but it does serve as a snapshot of where your page currently stands.
Facebook Reach
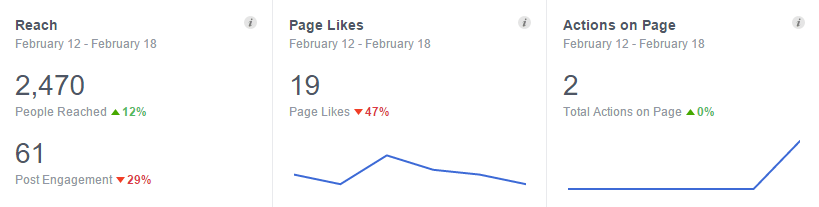
Reach on Facebook is based on the number of people that your content was shown to. It also factors in the number of people that have interacted with your content in terms of clicks, Likes, Comments and Shares.
In the screenshot above, the page has a reach of 2,470 for the seven day period between February 12th and February 18th. This means that 2,470 people have either seen and/or interacted with the content in their newsfeed or on the page’s Facebook page.
The post engagement is the number of interactions on the page’s content in the seven day period. This includes the number of Likes, Comments and Shares the content got and includes interactions from organic and paid sources.
Page Likes
The number of Page Likes still holds a special place for many page owners. However, most big brands have moved beyond looking at the number of Likes a page has as an indicator of success or popularity.
Actions on Page
Facebook pages offer admins a number of ways to drive business such as listing phone numbers, directions and links to a website. This metric is discussed in more detail further on in this guide. Page actions do not include interactions like people Liking, Commenting on or Sharing the content.
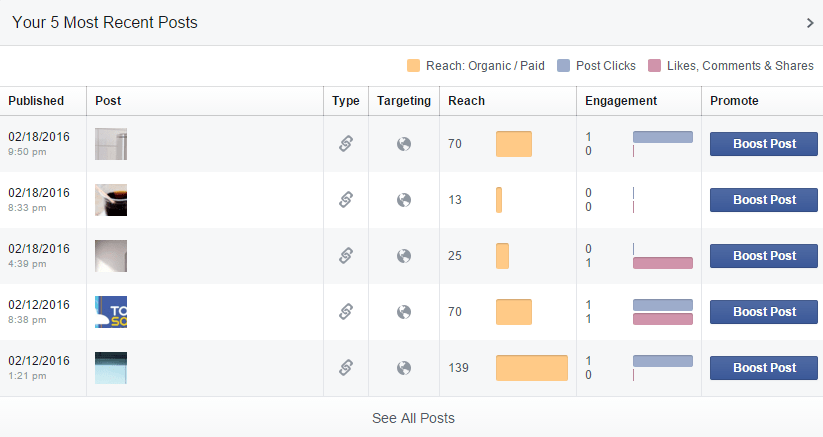
Most Recent Posts
Again, this page is the overview so the amount of insights that you’re likely to draw from it are going to be very low. The metric that most people tend to look at today is the Reach, although perhaps that’s more because it is a bigger number than the engagement.
The Reach of your content on Facebook is likely to be very low, a fraction of your total number of fans. There’s no need to get disheartened by this, Facebook is now very miserly about how much exposure it gives to Page content. Even if a post reaches 5% of your total fans, that can be considered a ‘win’.
Engagement can be measured in a variety of ways and everyone has their own reasons for choosing a particular method. For most of us, it’s about choosing a number that makes us look awesome infront of the client or boss! Facebook chooses to measure Engagement simply as the number of Likes, Comments, Shares and clicks that a piece of content received. However, a post that receives more Shares is going to see a higher Reach than a post that receives more Likes.
Pages to Watch
Facebook realized that brands and page admins are an insecure bunch so they added the ability for them to monitor some high level metrics from other Facebook Pages. Facebook does not reveal the Reach of other pages so if this metric is important to you then be aware that you can never find out the Reach of another page should you want to compare numbers.
Since Facebook calculates Engagement as the total number of Likes, Comments and Shares a piece of content has received, it’s very biased towards brands that have a higher number of fans. In the screenshot below, ‘Brand A’ has the highest engagement in the period analyzed with a score of 245. However, it has as much as 10 times the number of fans as many of the other brands being monitored.
In the screenshot below, ‘Brand E’ has a very high level of Engagement relative to the number of fans it has. It’s outliers like this that you need to investigate. If I were the page admin I would want to find out what content Brand E has produced that got such good engagement.
![]()
We can also see that simply producing more content is not a guaranteed way to increase the Engagement as shown in the case of ‘Brand D’. This page has published 16 pieces of content but has not been able to translate that into higher Engagement or higher fan growth.
You can monitor dozens of other Facebook pages through your Facebook Insights and get this high level data.
Likes
There are two types of Likes that get tracked by Facebook Insights. One refers to people Liking your page and the other refers to people Liking your content. In this section, we are looking at the number of people that are Liking your page.
The number of Page Likes is also referred to the number of Page Fans. Less commonly people might refer to it as the number of Page Followers.
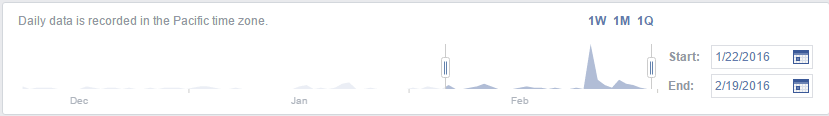
You are restricted to viewing data in up to 90 day segments. While this is usually enough for most page admins, it’s a big restriction if you want to view historical Facebook Likes (Fan) growth. To access historical growth data you can use a third party Facebook analytics tool like Unmetric.
Daily Likes
The chart below shows the number of new daily Likes (Fans) that your Facebook page has received. A spike in the number of new Likes suggests content that has performed particularly well or perhaps an offsite campaign or media article has caused a surge in interest around your brand. If none of these are applicable then perhaps an individual with a significant following (an ‘influencer’) has mentioned or recommended your business and people are coming to find out more.
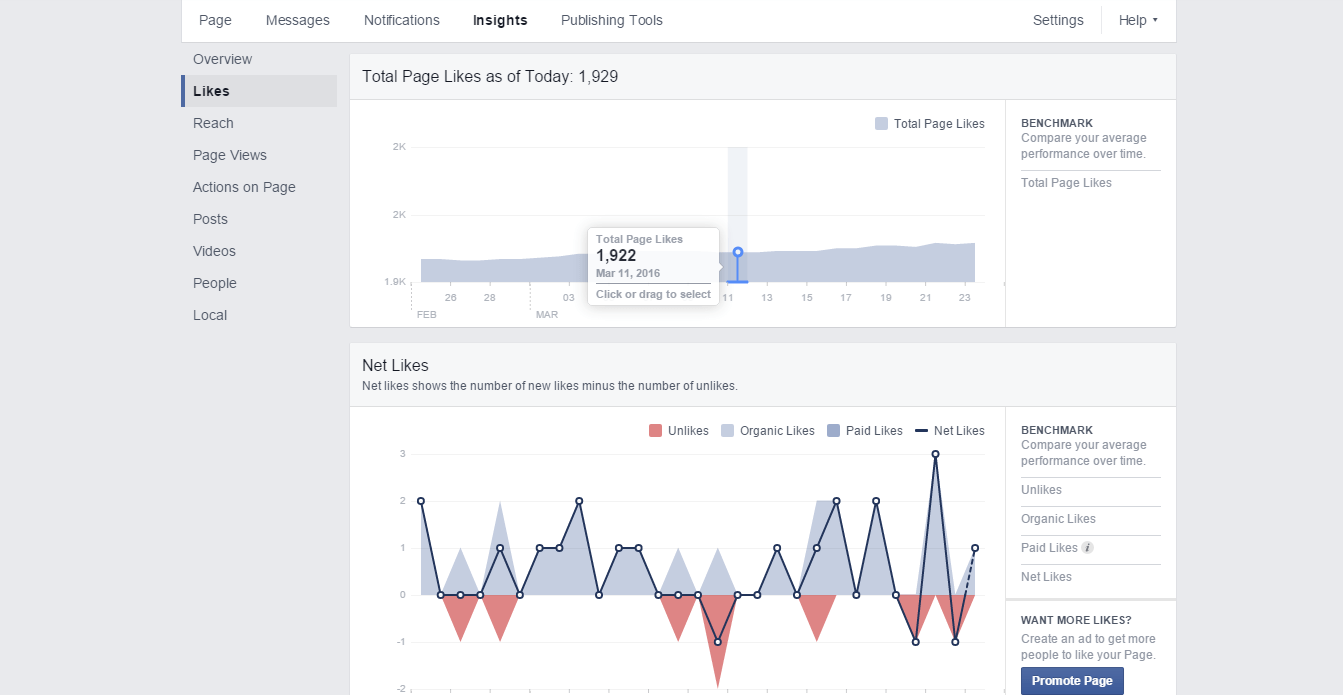
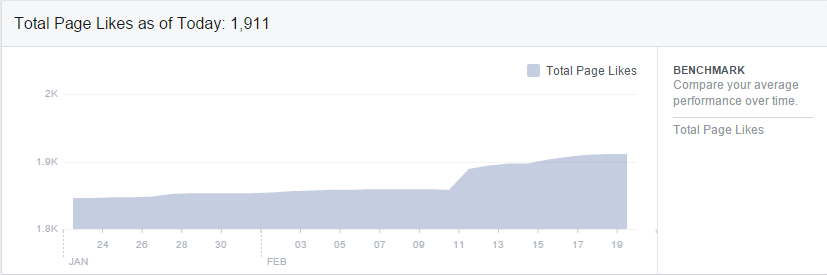
Total Page Likes
This chart lets you know how your page is growing (or shrinking) in terms of Page Likes (total Fans). Most active pages will grow steadily over time but as mentioned above, sudden growth should be investigated or noted if a campaign is being run.
Benchmarking Total Page Likes
Normally we’re all for Benchmarking here at Unmetric but Benchmarking the Total Page Likes against yourself has us puzzled. Perhaps because Page Likes are growing consistently over time you want to compare like to like. What puzzles us though is if you want to benchmark against Total Page Likes why not take the number at a fixed date each month? If you have any suggestions on this one, tweet us @unmetric.
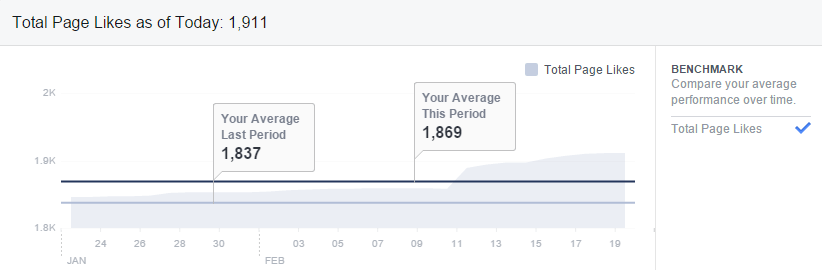
In our very humble opinion, when benchmarking Page Likes (fan numbers), it’s much better to do it in a wider context. Facebook Insights doesn’t allow you to do this so you need to use third party Facebook analytics apps like Unmetric to get this information. Unmetric lets you benchmark your Facebook Fan growth and Total Page Likes quickly and for any time period.
Net Likes
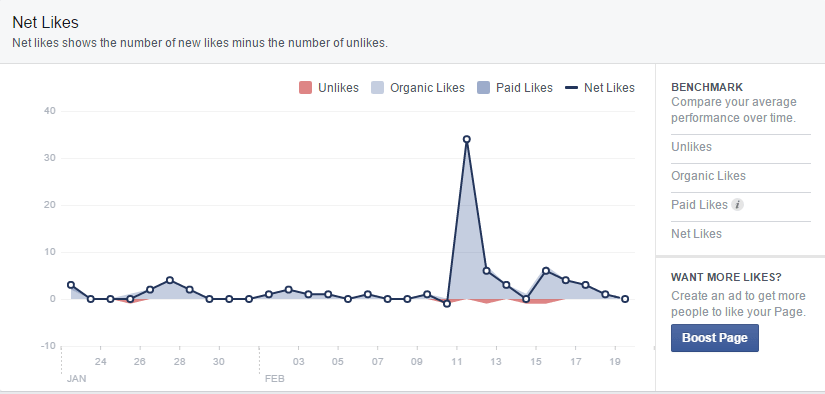
The Net Likes on your Facebook page is a breakdown of all your new Page Likes minus all the Unlikes (people that have Unliked your page). This chart is particularly useful because it lets you know if your paid efforts are generating new Page Likes.
Organic Likes means that people found your page by themselves (not via an ad), and Liked your page. If a piece of content gets lots of Shares then you are likely to see an increase in the number of Organic Likes.
The Net Likes chart is also helpful for you to identify when people are Unliking your page which might be a sign that a particular piece of content missed the mark or that you posted too much content on a particular day.
When you promote content on Facebook or when a particular piece of content organically goes viral, you might find that you see a higher than average number of Unlikes for the day. That’s quite normal and is relative to the number of people seeing your content.
You can use the Net Likes chart to benchmark your page growth and also your Unlikes. The time period is fixed to each month and counts the average number of Organic Likes, Paid Likes and Unlikes.
If you want to get more detail on Page growth, compare it against Facebook Pages that you compete against and see relative growth rate rather than empirical numbers, then you need to choose a separate social analytics tool like Unmetric.
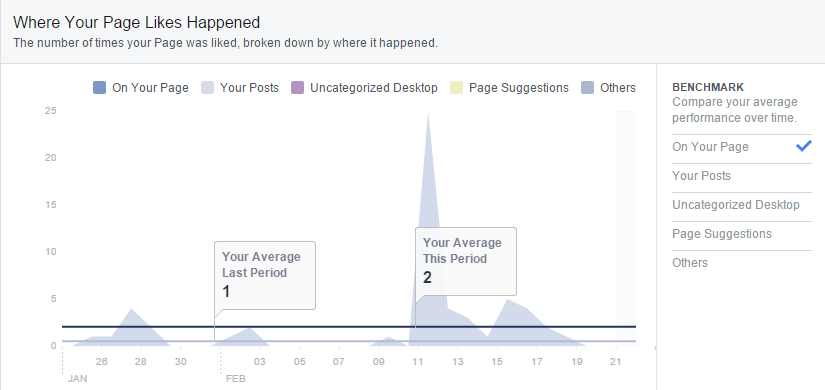
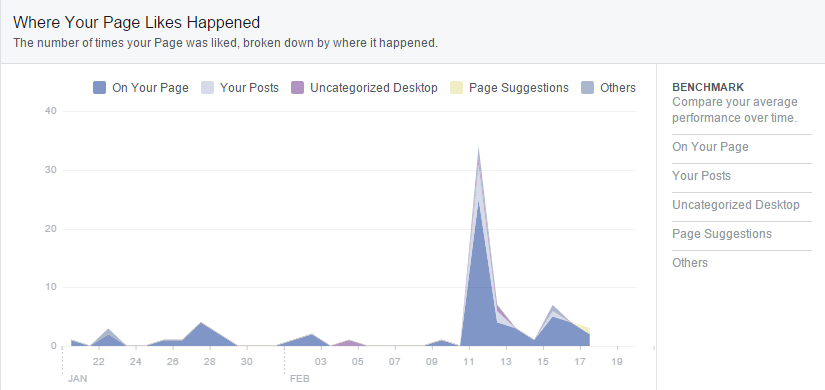
Where Your Page Likes Happened
If you want to increase your Page Likes (the number of Facebook Fans on your Page) then knowing where you are getting those Page Likes from is very important to know. It’s also useful for uncovered new sources for Page Likes that you may have overlooked.
In the chart below we can see that the bulk of the Page Likes came on the page itself. This means people came to the page and clicked on the Like button. We suspect that this is going to be true for most Facebook Pages.
Uncategorized Desktop lead sources can cover a whole range of sources. For example if a user shares some of your content on their wall and their friend Likes your page via this post then it’s tagged as Uncategorized Desktop (or Mobile). If you think it’s vague, we agree!
As with the other charts in the Likes page, you can benchmark your Page Like sources for fixed monthly periods to see how you are doing on a month by month basis.
Reach
Facebook Reach is a metric that you could say is a hangover from mass media measurements. In its most basic form it is the unique number of people that have been exposed to the content that you have posted on your Facebook Page.
The important word here is ‘unique’. Even if a person saw the content several times, it is only counted once towards the total Reach. If 1,000 people each saw your post three times in their newsfeed then the Reach is still only counted as 1,000. If 1,000 people each saw three different posts then the total Reach would be 3,000.
Daily Reach
The Daily Reach shows the total Reach of your Page each day. Even if you posted content on the 10th of the month, if someone saw it on the 15th of the month then the Reach is calculated for the 15th. The important thing to look at in this chart is the trend. If you start to post more frequently do you achieve higher Reach? If you stop posting as regularly, how quickly does the Daily Reach decrease?
The chart below shows that the page started achieving a much higher Reach in the middle of January compared to December, perhaps due to an increase in content being posted.
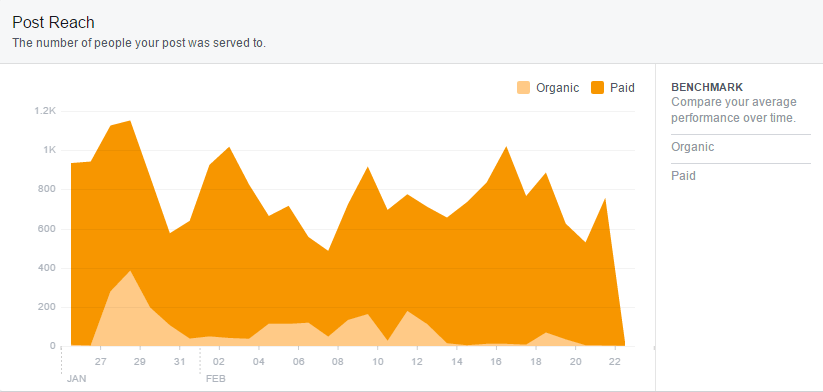
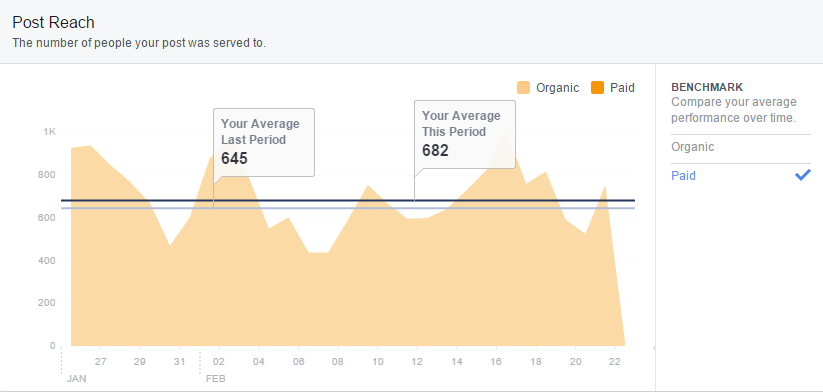
Post Reach
The Post Reach chart is very similar to the Daily Reach chart with the biggest difference being that it breaks down the Reach by Organic and Paid sources. In this case, Paid Reach means when you promoted (Boosted) a piece of content, how many unique people did it reach. Organic Reach is everything else.
It should be noted that your Facebook Page can gain Reach in many other ways which are discussed further down in this guide but for Post Reach it only considers people that have seen the content posted to your Facebook Page.
Given that Facebook’s Organic Reach has been cut drastically from a few years ago, you are only likely to get higher Reach when you Boost the content. The chart below is a clear illustration of this. The Organic Reach is a fraction of the total Page Reach.
When there is a spike in Organic Reach, special attention should be paid to the type of content that was posted because it can signify that it was a particularly engaging piece of content that might warrant an additional paid element to boost the Reach even further.
Besides promoting your content by Boosting it, the most effective method to increase the Reach of your content is to get more people Sharing it.
To see how your content is performing in terms of Reach, you can benchmark your efforts on a monthly basis in Facebook Insights. In the chart below we can see that the Page received higher Organic Reach in January compared to February.
The reason for generating lower Organic Reach is something that the social media analyst, community manager or social media manager needs to investigate. Was it because less content was published or was there a change in content strategy or were there fewer shares on the content this time? The data is a signal to what happened but in needs further investigation to connect the dots to find out why it happened.
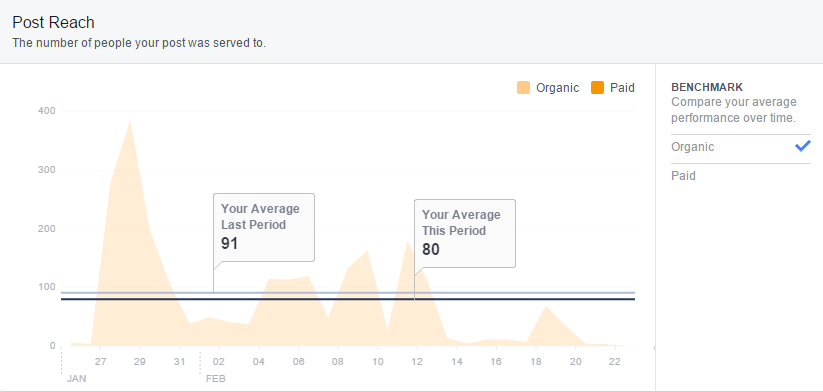
However, the Paid Reach had a higher Reach on average in February compared to January, perhaps as a result of an increase in ad spend.
Likes, Comments, and Shares
Aside from the fact that we can tell that the copywriter for Facebook Insights has a penchant for the Oxford comma, there’s plenty of detail to be had in this chart for Facebook Page managers.
To begin with, most content you publish is going to receive far more Likes than Comments and Shares. However, it’s Shares that have the biggest impact on the total Reach of the content so pay particular attention to content that receives a high number of Shares. Such posts may also be good candidates for Boosting if you wish to increase your Reach even further.
The interactions on your content is going to coincide with how frequently you post and how many Page Likes (Fans) your page has. Watch out for any daily spikes of Likes, Comments or Shares as this is a sign that you need to dig further to see why you got so many more interactions on that day.
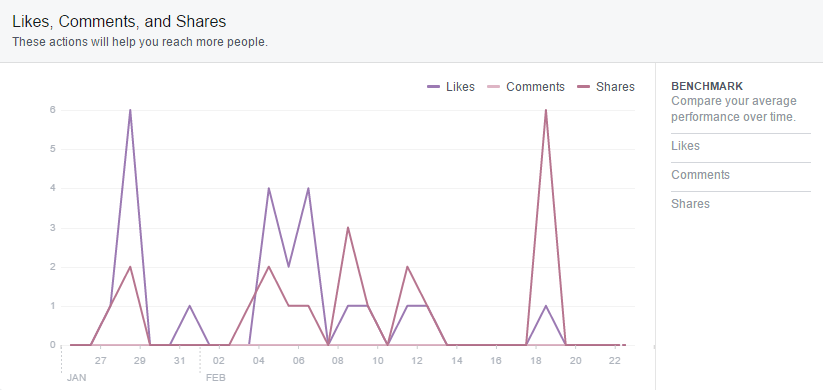
You can benchmark how well your content is doing in terms of interactions. The benchmarking options in Facebook Insights are rather limited in that you can only benchmark between monthly time periods and only against your own page. However, it’s always useful to know whether you are improving in these metrics or if your strategy needs to be changed a bit.
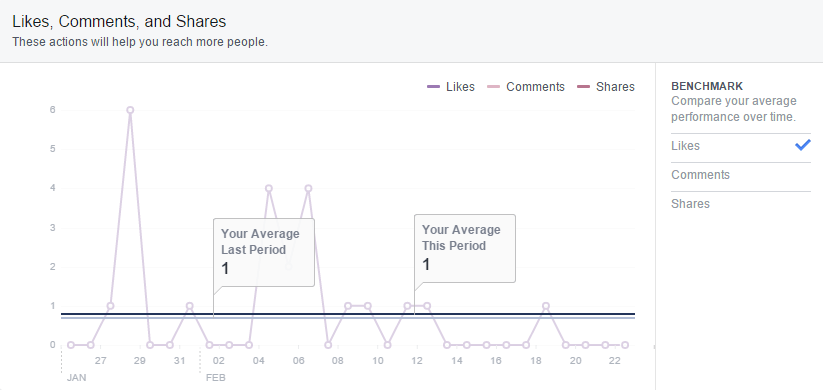
Facebook Insights is rather limited when it comes to benchmarking, particularly when it comes to competitive intelligence. Since Likes, Comments and Shares interactions are so important for a page manager, ideally they should be benchmarked in a wider context such as against other pages.
Third party social analytics platforms like Unmetric allow you to benchmark your user interactions across any time period and against any other page. This gives you a big picture view of where your Page stands and is a true indication of how your content is performing.
At Unmetric, we believe that the simple counting of interactions is not an effective measure of user engagement. As noted earlier, a Facebook Page can increase its Reach if its content receives more Shares as more people will see it. However if a user simply Likes the content the Reach does not increase. Additionally, when benchmarking against a Page that has far higher or fewer Page Likes, the number of interactions is likely to be proportional to that number and is therefore an unfair comparison.
For this reason, Unmetric’s Facebook analytics platform has built an Engagement Score which is a normalized score between 0 and 1,000, weighs Shares to be more valuable than Likes and Comments and factors in the number of Page Likes so that Pages with more or less fans can be fairly benchmarked.
From the chart above, we saw how [brand x] was crushing it with its interactions. However, when we look at the Engagement Score, [brand y] achieves a higher engagement as a result of it having less Page Likes but proportionally more interactions, particularly Shares.
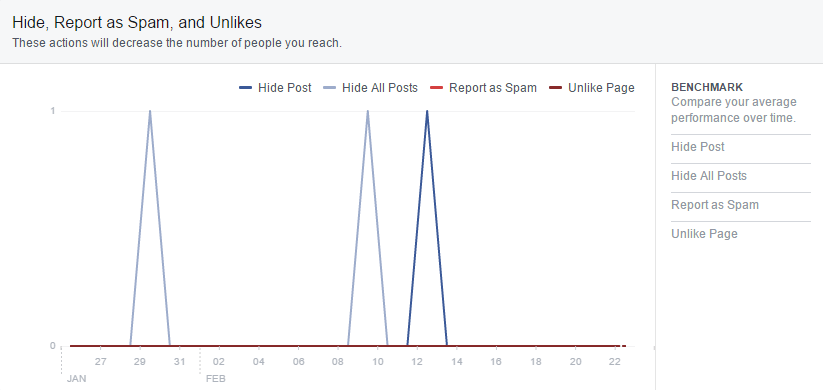
Hide, Report as Spam, and Unlikes
This chart is perhaps one of the most important charts found in your Facebook Insights section. It tells you what people are thinking about your content (beyond the new Facebook Reactions). Knowing what people are doing to avoid seeing your content and when they are doing it helps you to narrow down any problems with the kind and frequency of content that you publish.
In the chart below, there were only three actions in the two month period analyzed. For Facebook Pages with more Page Likes, there is likely to be far more actions on this chart.
A Hide Post action suggests that the person is happy to see content from your Page but perhaps this one just didn’t connect. Today, many brands are taking a stance on various social issues and if a piece of content that talks about that social issue doesn’t resonate with the person, they are likely to hide it. Keep an eye on when people are hiding your posts and see if there’s a pattern in the types of posts that get hidden most often.
Hide All Posts is when your content strategy is missing the mark for a particular person. They initially took the time to Like your Page, but now they are no longer interested in the content you product. Perhaps it’s because it is a time-bound thing for example a new parent Liking a diaper brand is relevant at the time but now it’s no longer relevant to them. Alternatively it could be because your content strategy involves too many posts or too much irrelevant content. This is a key metric to track because having too many people hide all your content drastically reduces your Page Reach.
Having your content being reporting as spam is something no Community Manager wants. You can’t escape getting a few spam reports now and then – especially if you have a large fan base and post frequently. However, if there is a spike in the number of Spam Reports it’s likely your content is going in the wrong direction.
Finally you have the number of people who have Unliked your Page. As heartbreaking as this may be, you have to accept that there will be Unlikes for as long as you are a Facebook Page Manager. However, a significant rise in the number of Unlikes is a cause for concern. As mentioned earlier, if your brand decides to take a position on a divisive social cause, disagreement could manifest itself in an increase in Unlikes. In such a case it would be useful to track whether there was a corresponding rise in new Page Likes.
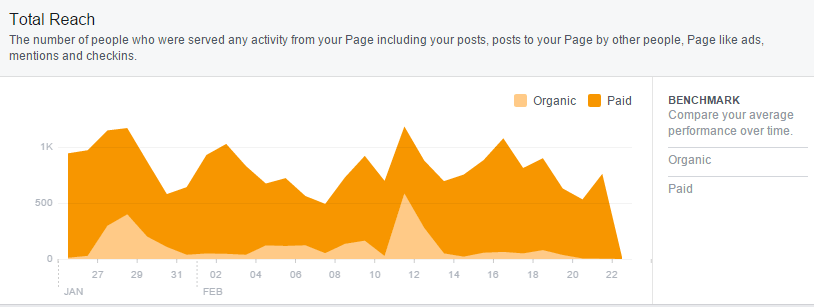
Total Reach
There are so many different permutations of Reach that it can easily get confusing as to what Reach you are reporting on. In general, most people will think of Reach as the Total Reach. This includes everything from people who saw your content on their newsfeeds, people who saw your page being tagged in someone’s post, Page ads, checkins and so on.
The Total Reach chart featured below is different from the Post Reach chart featured above in that it includes every touchpoint on your Page where a person can view and interact with it. The Post Reach Chart only considers Reach on the content published by the Brand.
Page Views
Page Views are people that have come to your Facebook Page. It doesn’t mean views of your content on a person’s Timeline.
Total Views
The Total Views is the number of times your page has been seen by users. This is not a unique number as a person viewing the page twice in a day would be counted as two page views.
You might notice patterns to the Total Views and some things to look out for are whether Page Views are higher on a particular day of the week or if you get less Page Views at the weekend. This can help you with your posting schedule as more Page Views on a particular day means you might get more visibility on any content on that day.
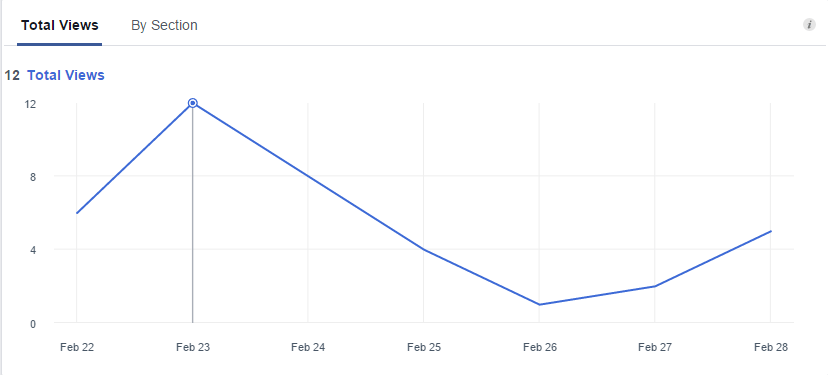
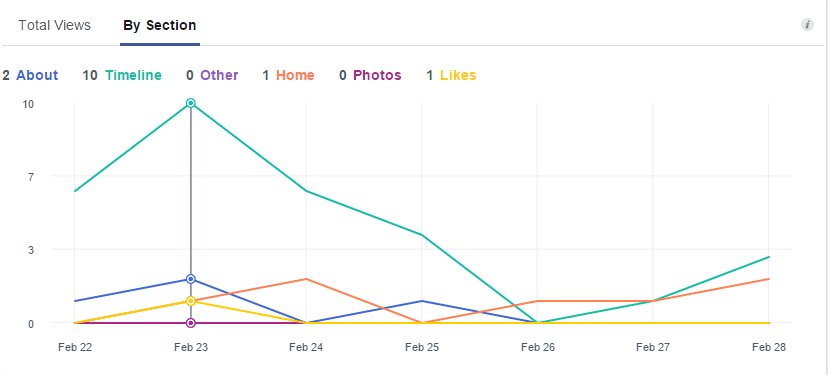
The Total Views chart also breaks down the Page Views based on where they occurred. For most Faceboo Pages, Page Views are going to happen on their Timeline. If you notice many people are looking at the About section on your Facebook Page, double check that it contains relevant and useful information to a user.
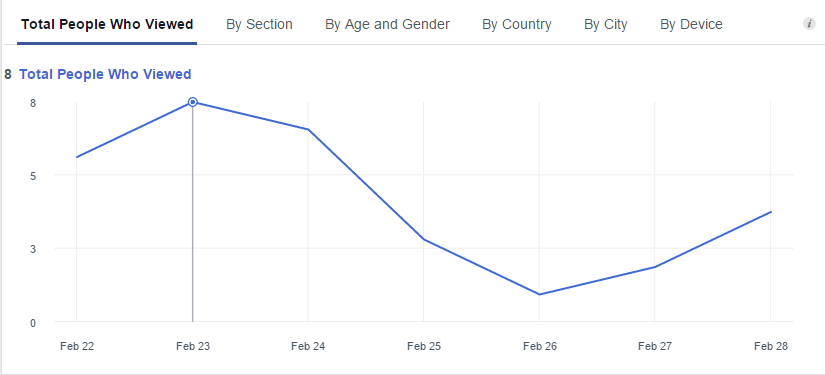
Total People Who Viewed
This metric is different from the Total Views in that it looks at unique views. As with the Total Views you can use this chart to spot patterns on particular days of the week that see higher Page Views than normal.
By Section
Similar to the Total Views chart that breaks down Page Views by Section, this chart also shows which parts of your Facebook Page are getting the most unique visitors. Again, for most brands the Timeline will be the most visited section of the Page.

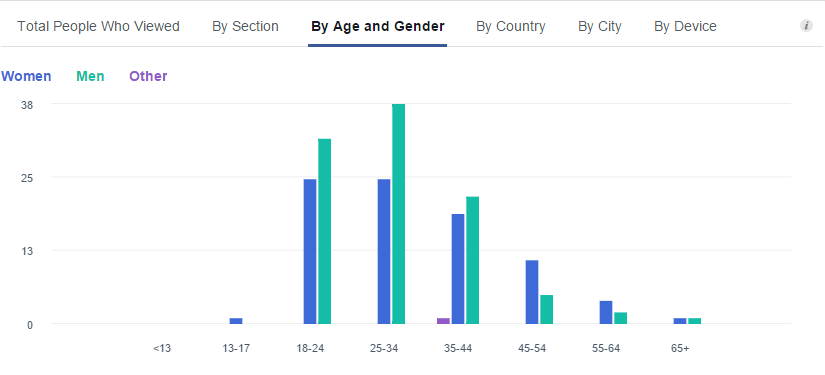
By Age & Gender
To help you understand your audience better, Facebook Insights shows you the demographics of the people that viewed your page. The chart below shows that this particular Facebook Page was most popular with 18 to 44 year olds and most of the viewers were male.
Knowing your fan demographic is vital to create content that appeals to it, particularly for consumer brands. Since this chart shows the people that are actively visiting your Facebook Page rather than just seeing your content in their newsfeed, the Cover Image plays an important role as it’s the first thing that they see.
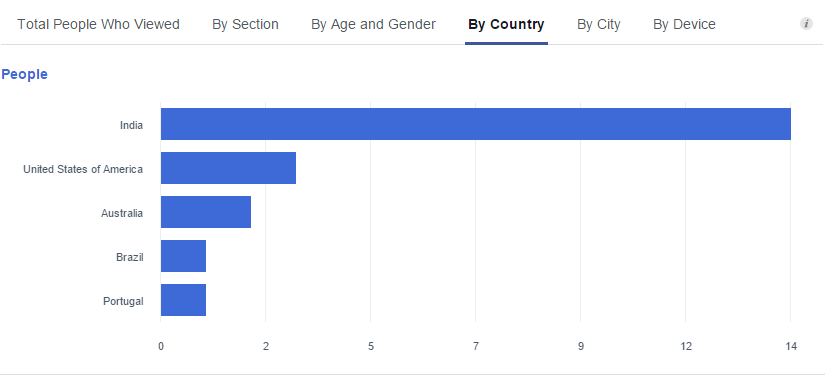
By Country
Knowing the overall demographic of all the people that Like your Facebook Page is one thing, but knowing the people that actually visit your Facebook Page is more insightful. The chart below shows that the Facebook Page gets most of its Page Views from India, followed by America.
This chart is important not just to the social media manager but for the wider organization as well. It tells businesses from which part of the world it is attracting people. For global businesses they can get an idea of which countries has more opportunity. For smaller businesses they might be able to identify new markets based on the location of people visiting their page.
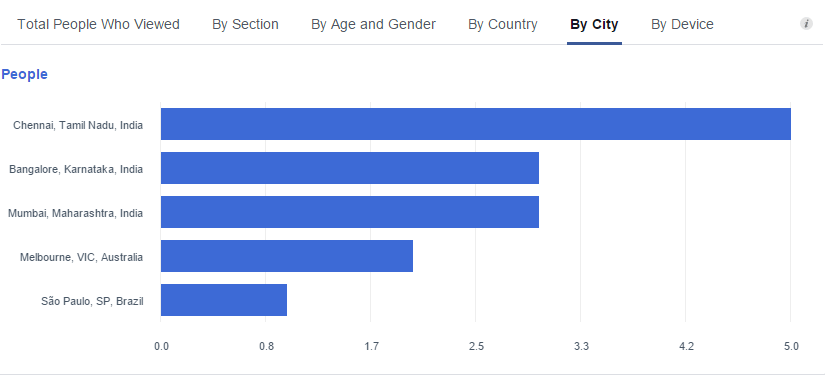
By City
Zeroing in on the city from which people who viewed your Facebook Page are coming from is useful to spot micro-trends and opportunities. For example, a local business that is suddenly attracting more attention from a nearby city is a signal that there might be an opportunity in the next city. Similarly, a national business can correlate whether the city of the people who viewed their page correlates with their revenue sources – and if not, why not?
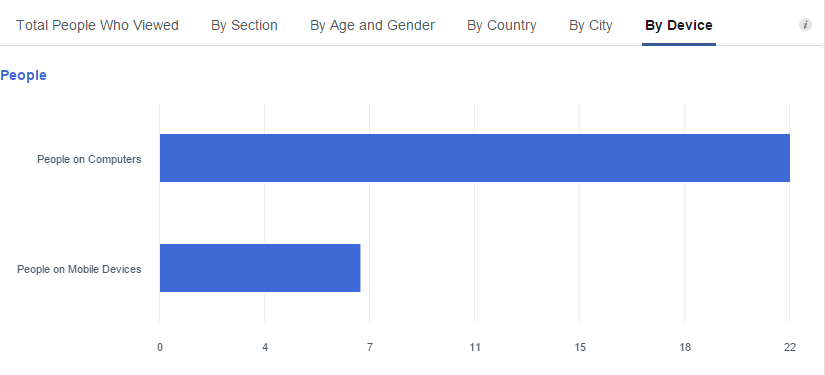
By Device
At first glance you might wonder why it matters how people are consuming your content. It’s actually quite insightful. Knowing the device on which people are viewing your Page tells you a lot about their current situation. A person looking at your Page from their computer implies that they are stationary and likely in an office. A person looking at your Page on their mobile device implies that they are on the go or in a more relaxed situation.
A local restaurant might see more Page views from a mobile device as people are searching for somewhere to eat. A company that operates in the business to business domain might see more page views from people on a computer. Ultimately it should help you understand the frame of mind a person is in when they are looking at your site so that your content can be tailored towards that.
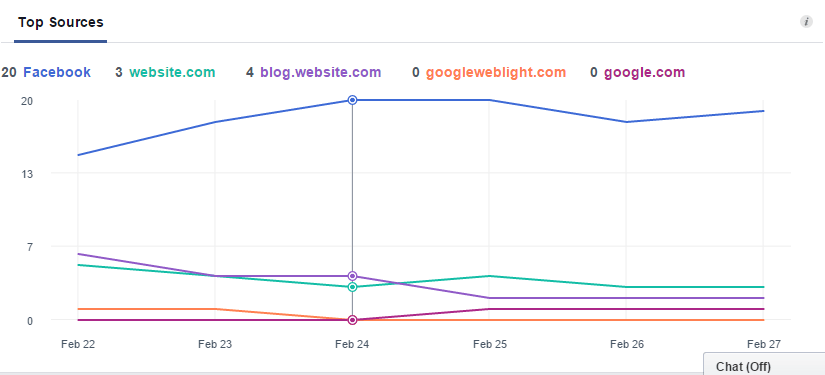
Top Sources
Sources means where did people come from before they visited your Facebook Page. For most Pages, the user was likely already on Facebook and either saw an ad or some content that led them to the Page.
It’s useful to know which websites people were on before they visited your Facebook Page because it might uncover a new traffic source that you weren’t aware of. There may also be trends that you can spot, for example, if you add a Facebook button to your website, how effective was it at driving traffic to your Facebook page? If you pay for a listing on an online business directory and it gives you the option of listing your Facebook page, how many Page Views did that listing generate?
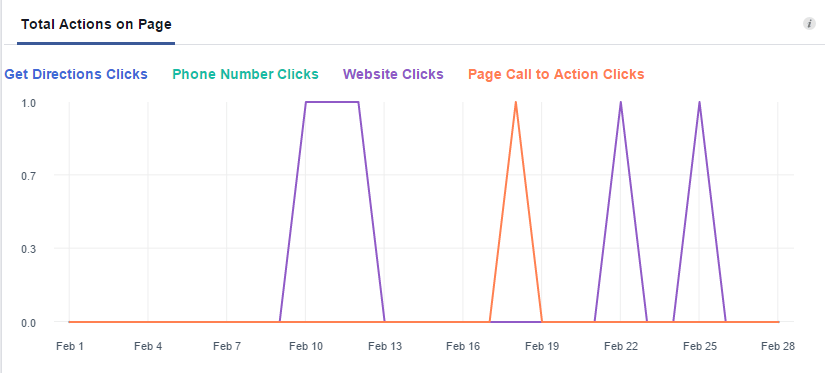
Actions on Page
Total Actions on Page
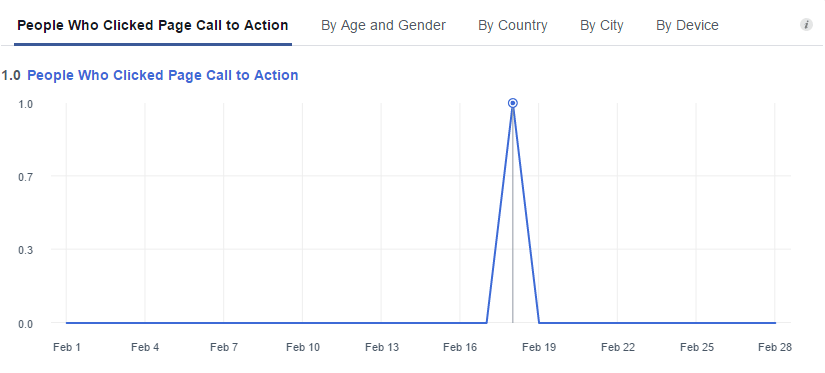
People Who Clicked Page CTA
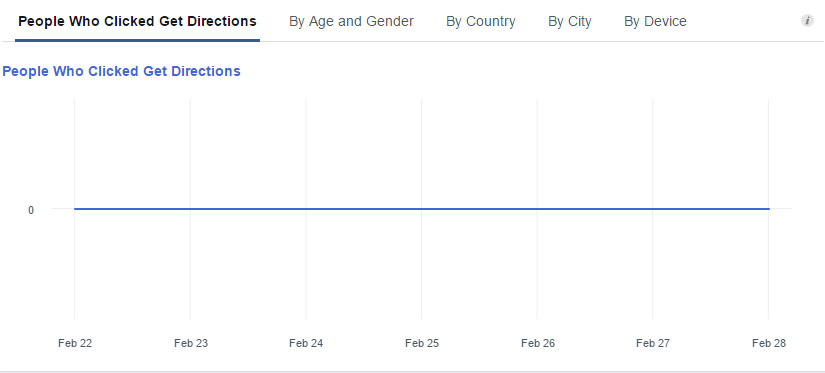
People Who Clicked Page Directions
People Who Clicked Phone Number
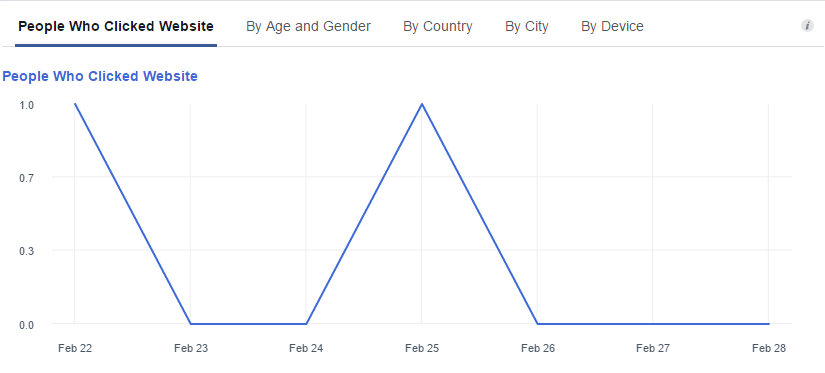
People Who Clicked Website
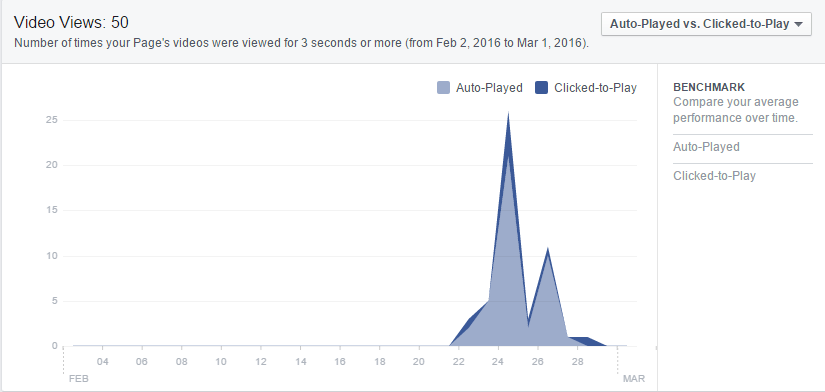
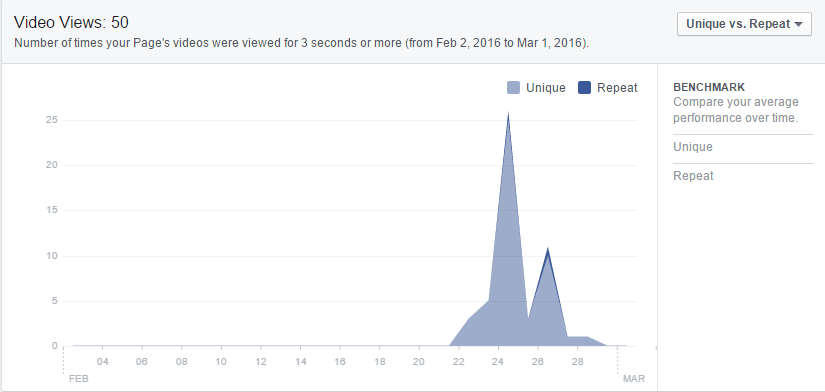
Videos
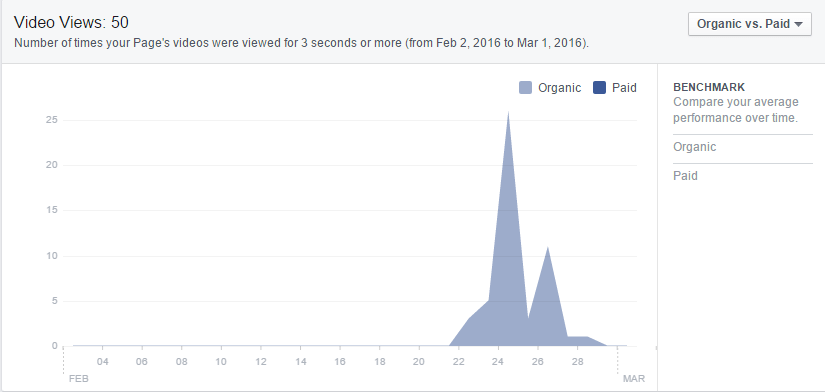
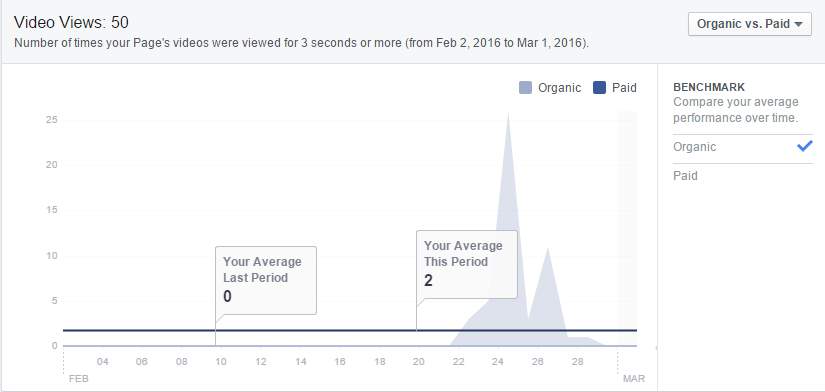
Views
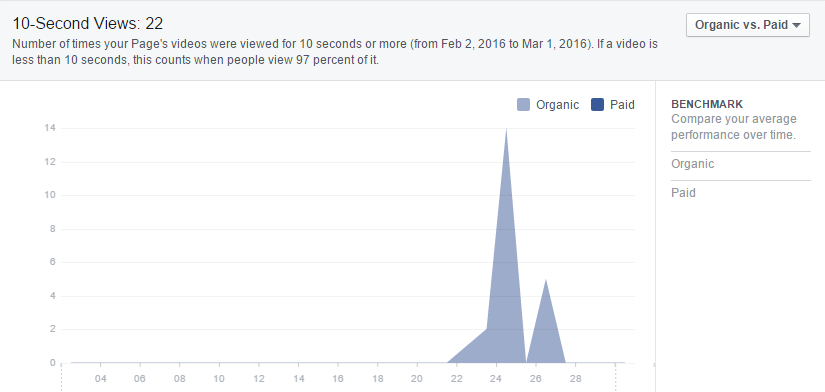
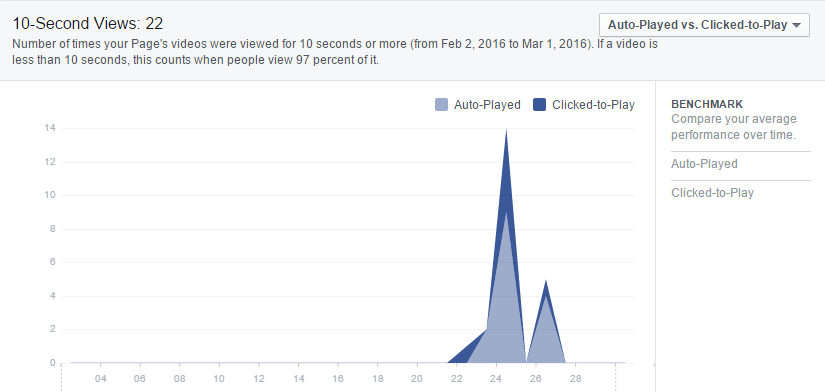
10 Second Views
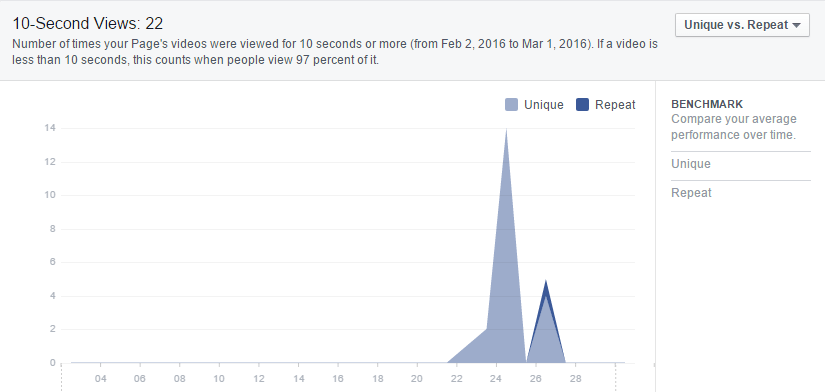
Top Videos
People
The People tab can tell you a lot about the content you need to be creating to engage your audience. Here’s how to analyze these pages.
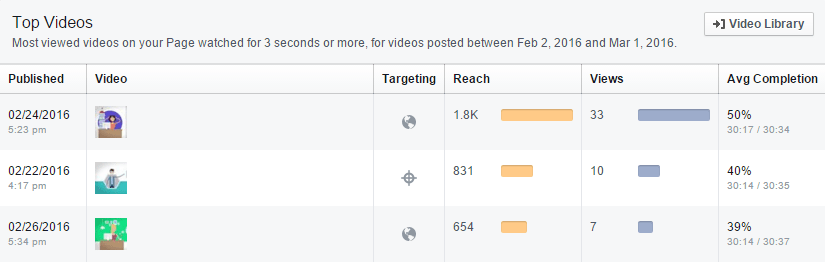
Your Fans
This should be an eye opener for you, especially if you think you know your target audience. The screenshot below shows us that most of the fans of this page are male and between the ages of 18 and 44.
This demographic is actually what we would expect for a SaaS based analytics platform. However, sometimes the fan demographics can throw up some surprising results. Take the male personal care brand Axe for example. It’s squarely targeted at men and although the new branding has moved away from it, the Axe Effect branding reinforced the notion that the brand was aimed at young, single, confident men. Some even pointed out the brazen sexism in past campaigns.
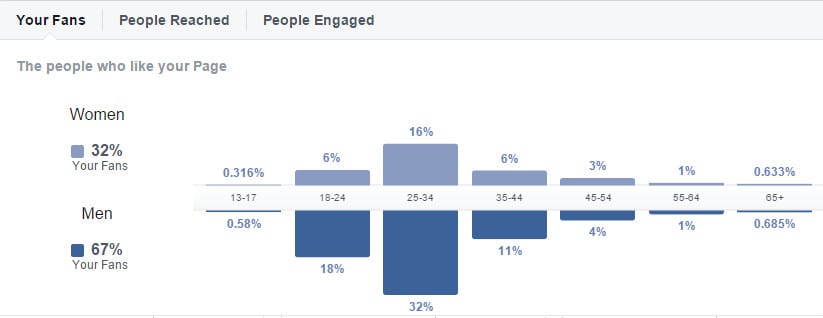
However, if we use an analytics tool that can tell us the demographic Axe (even when you don’t have access to the Facebook Insights of that brand), a very interesting picture is revealed. 65% of the fans are actually female, which is very unusual considering Axe is a male targeted product. Another interesting point to note is that although most fans are between 21 and 30, the age demographic is fairly consistent between 13 and 50. This means that there was a significant audience that wasn’t being spoken to in the Axe Effect ads. Additionally, at least 50% of Axe’s fans are in a relationship of some kind – again, not the single man looking to attract women that Axe portrayed in its ads.
Perhaps it’s this kind of data that led to Axe’s reinvention campaign as a male personal care brand for everyone.
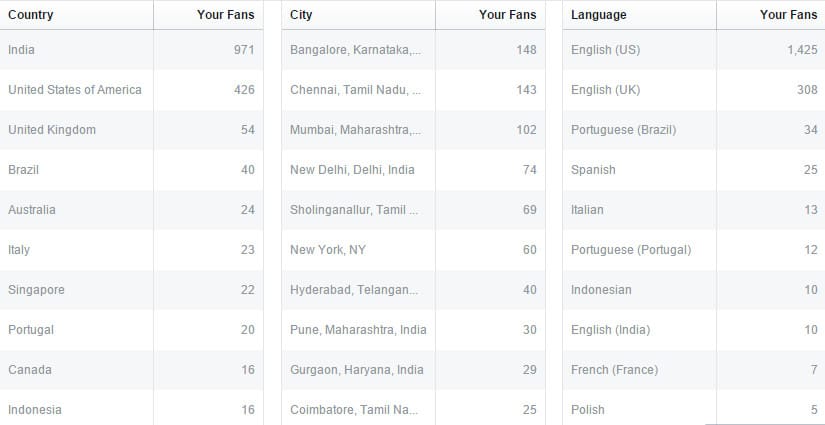
The next great bit of information from your fan demographics tab is where your fans come from. In this instance, nearly all the fans of this page are from India or the United States. The majority are from three cities in India and most of the fans have set English as their primary language on Facebook.
As the owner of a Facebook page, knowing where your fans are coming from is vitally important to help you craft your content and marketing strategies. In this case, most fans are from India so if the page wants to increase engagement it would do well to produce content that appeals to the Indian market.
However, Facebook Insights doesn’t tell you two key things. One, how fast your audience is growing in different locations and two, the fan locations of your competitors. This is where a third party Facebook analytics tool helps you out.
Qatar Airways is a popular airline serving the lucrative and busy Middle East market. Its routes connect America and Europe with Asia, Africa and the Far East. At the time of writing this guide (February, 2016), Qatar Airways had over 11.2 million fans on Facebook – and growing by 4.2% every month (about 440,000 new fans). Qatar Airways flies to over 140 destinations, but it remains more popular in some countries than others.
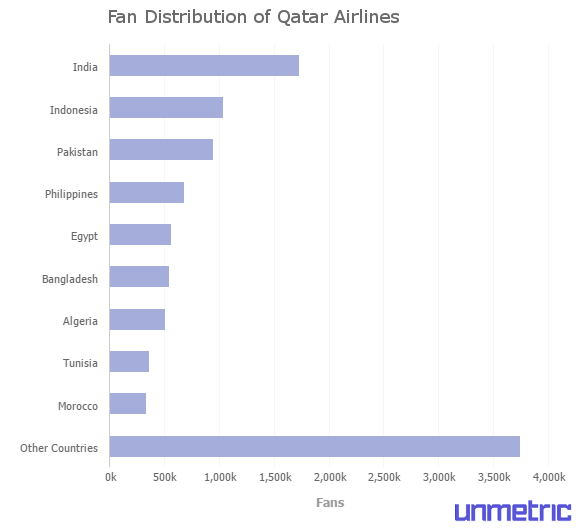
Asian and African countries make up the bulk of Qatar Airways’ fanbase. This gives two insights for the social media manager of the airline.
Firstly, offers and content can be targeted towards countries where it has a large number of fans. Marketing campaigns that touch the culture of the country can be initiated, much like British Airways did with its recent ad. The large fanbases in countries like India, Indonesia and Pakistan mean that the airline could gain a large amount of exposure from fans sharing such content.
On the flip side, the marketing team might want to launch a campaign that targets countries where it doesn’t have such a big presence. Qatar Airways flies to many European countries but has relatively few fans from them.
The social media manager for Qatar Airways could go one step further and compare the fan distribution with other competing airlines in the region. Facebook Insights doesn’t allow this type of comparison, but using a third party Facebook analytics app, this kind of competitive intelligence can be found.
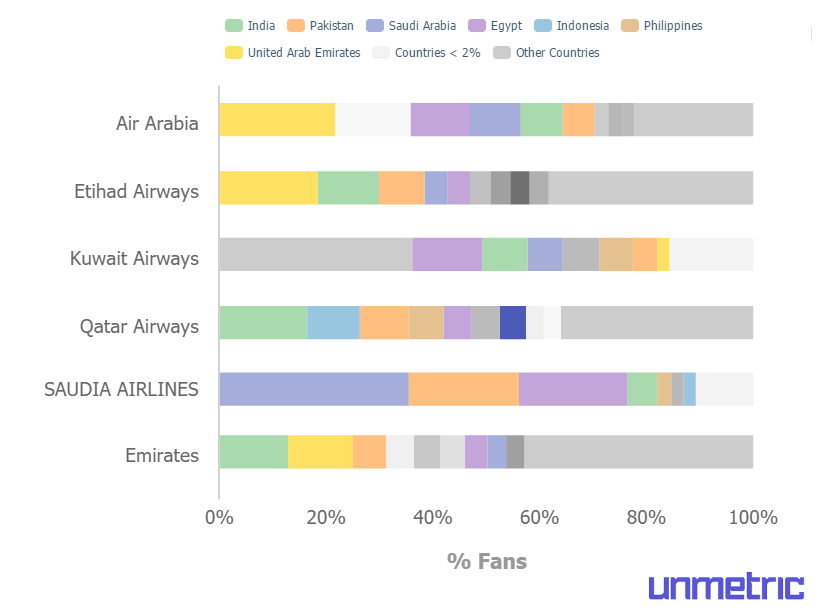
Now, if I was the Qatar Airways, I’d probably be looking at Emirates, wondering why they have got a higher proportion of fans from America, the UK and Australia and thinking how I could target people in these countries. If I was the social media manager for Saudia Airlines or Kuwait Airways I would be looking at ways to increase my fan base in other regions beyond the home country.
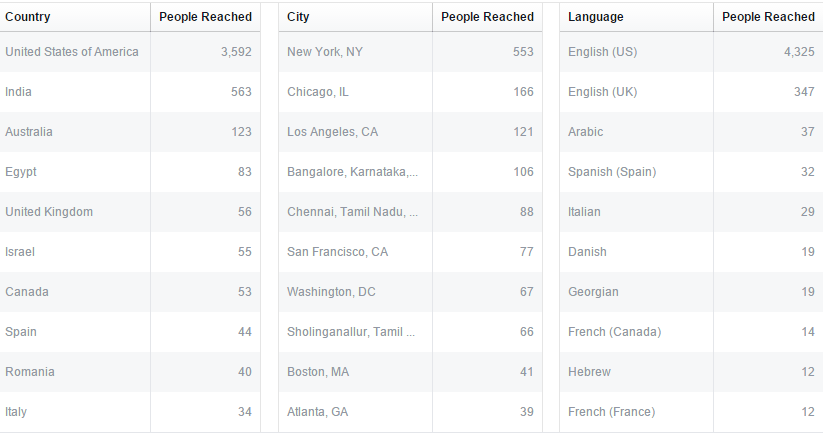
People Reached
We talked about Reach in the earlier section of this guide. On the People Reached page, Facebook Insights tells us the demographic that our content is reaching. This is really useful to the social media analyst because the people being reached by your content might be different to the demographic of fans.
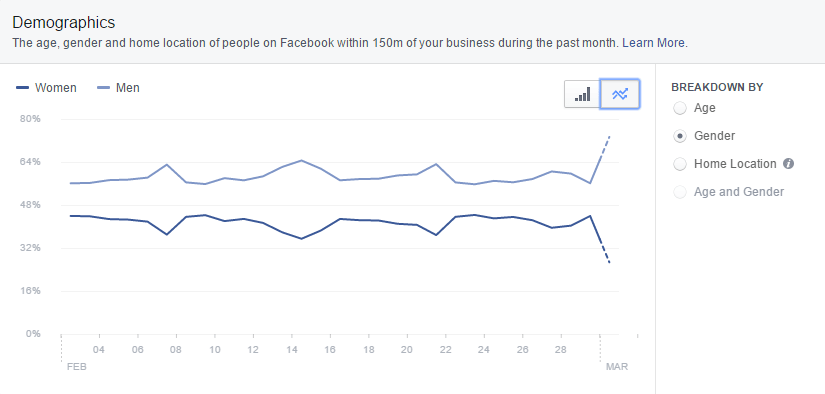
The kind of people reached for the page in the screenshot below, it is evenly distributed between the genders. This might be on purpose by Facebook as it looks to balance the gender skew towards males. Still, for the social media analyst, it suggests that creating content that primarily appeals to 18 to 34 year is what will engage best since these people are the ones actually seeing your content.
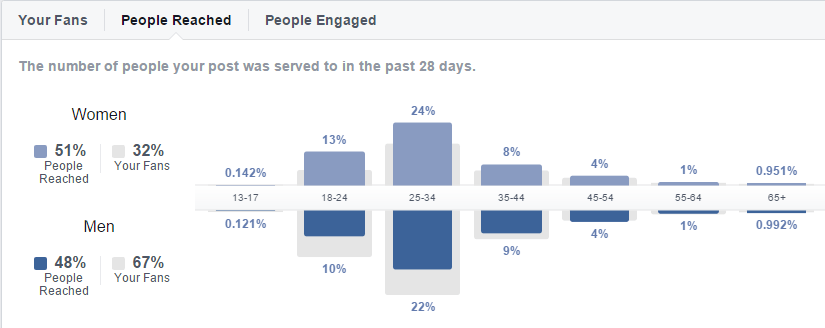
It’s also useful to know which countries and cities are being reached by your content. In this case, although most of the fans were from India, the content is reaching far more people in the US. This means the content could be tailored more towards the US market if that’s where it’s getting the most reach.
People Engaged
This is the real juicy data from the People tab. I don’t know why it isn’t the first chart that’s shown. It tells us the exact demographic that engaging with our content. I would argue that this is more important than our total page demographic and the demographic that our content is reaching combined. It’s serving up on a platter the type of people that want to see more of your content and want to engage with your page.
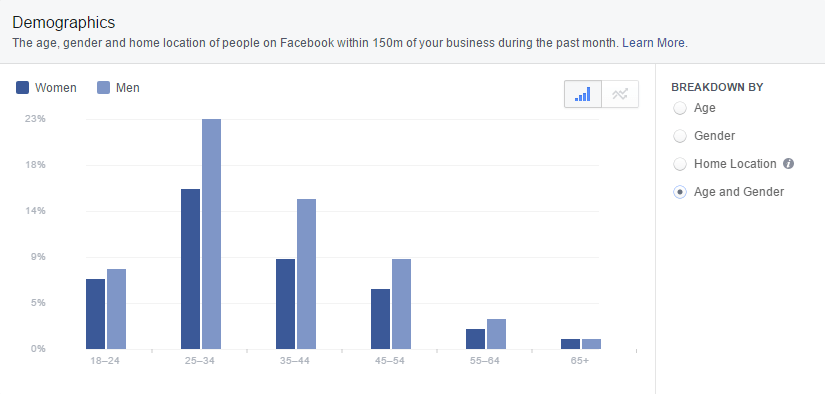
For the page featured in the screenshot below, marginally more women than men are engaging with its content. What’s interesting is that the engagement is similar across a wider range of ages compared to men. The big takeaway here is that the social media manager needs to be publishing content that appeals to a broad age-range of women but also to the 25-44 year old male.
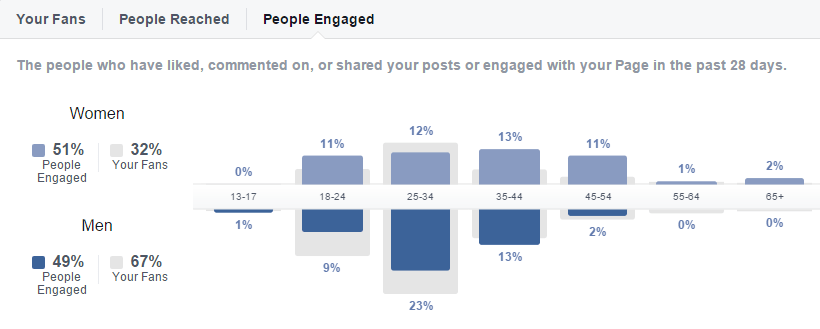
Other pages might find that even though they have a fan demographic that skews towards a particular age range or gender, the people engaging with the content might be different. To generate higher engagement, your content should be created for the demographic which is actually engaging with your page rather than the demographic you think your product or service is aimed at.
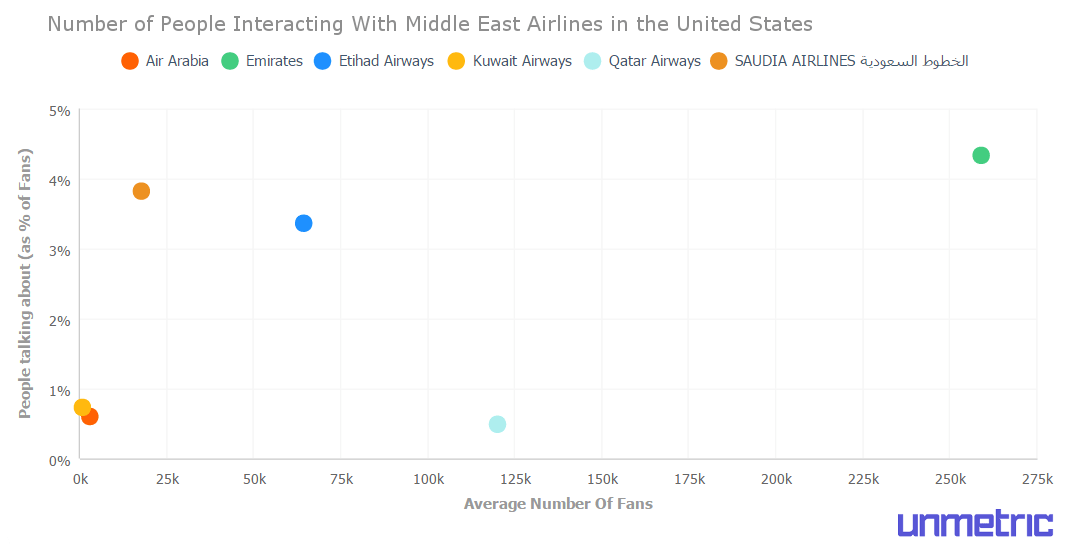
Competitive Data on People Reached and People Engaged
Unfortunately there is no way to get data on the demographic your competitors’ pages are reaching or the people that are engaging with it. Even third party Facebook analytics tools don’t offer this data as it’s not provided by Facebook in the open graph.
That said, there is one way to get some high level country-wise data on which location a brand is engaging with best. By using the People Talking About This metric, which is defunct in your Facebook Insights page analytics dashboard but still available in the open graph, we can find out which countries are engaging best with the brand.
Sticking with Qatar Airways from our earlier example, in the chart below, we can see that the airline is not connecting with as many fans in the United States as other Middle Eastern airlines. This could represent an opportunity because if other airlines are able to connect with this audience then Qatar Airways should be able to as well.
Local
Radius
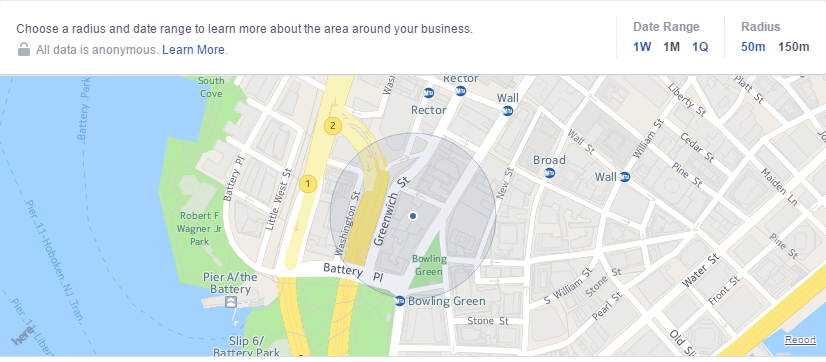
Daily Averages
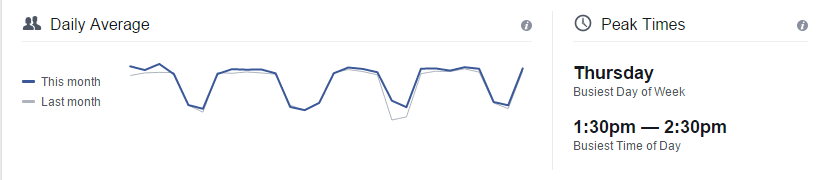
Ad Performance
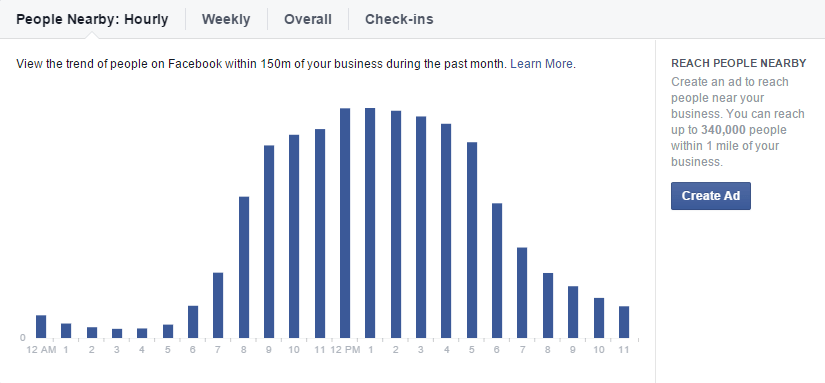
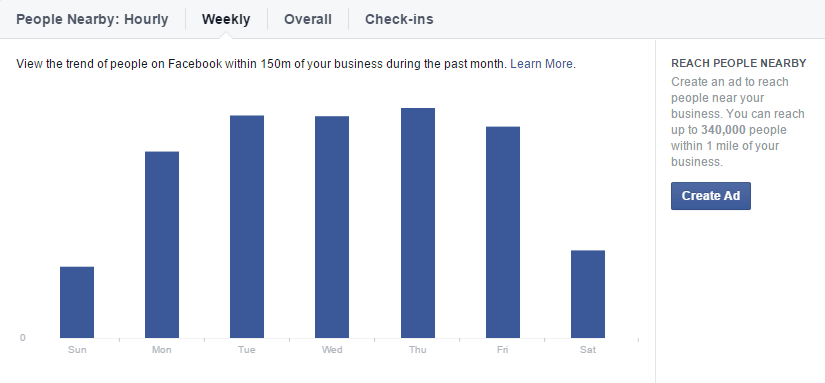
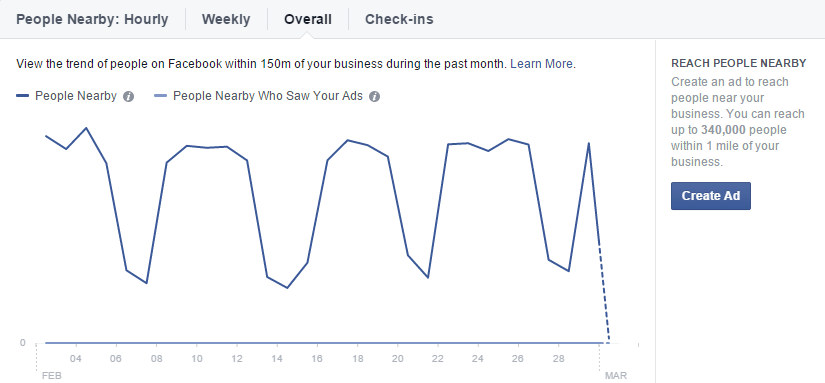
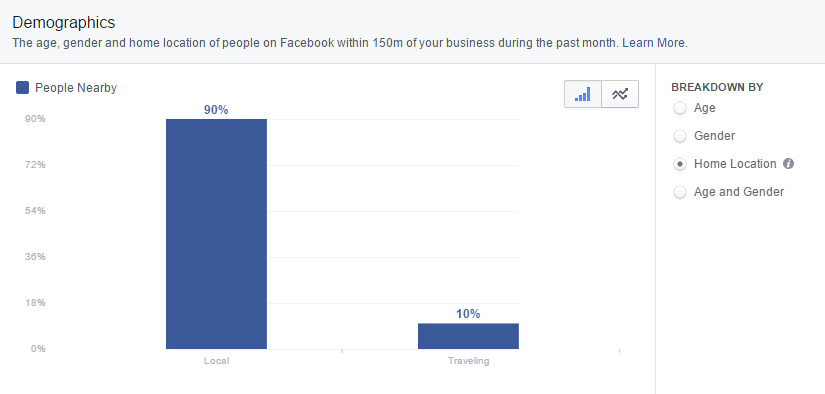
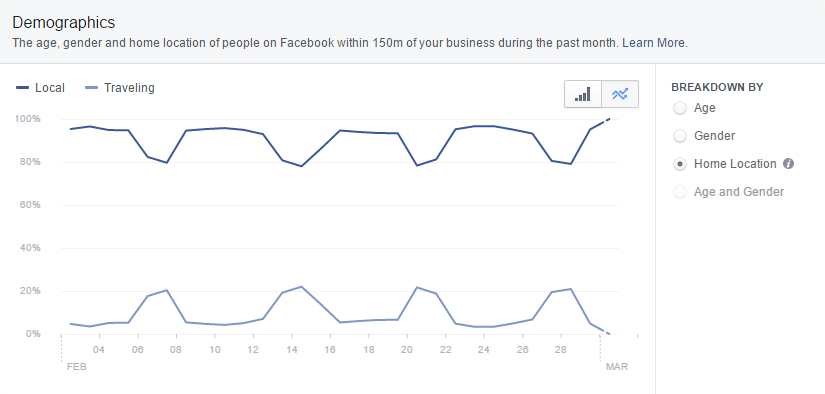
People Nearby
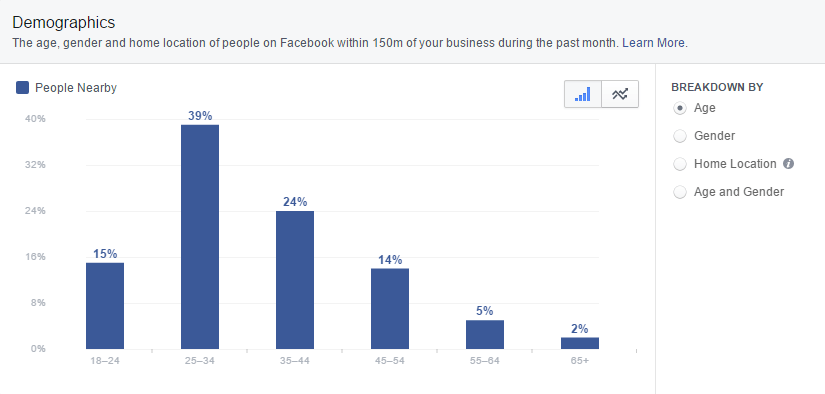
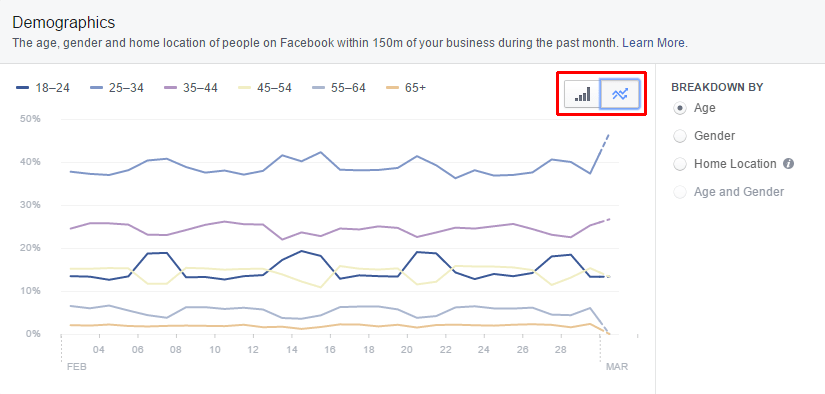
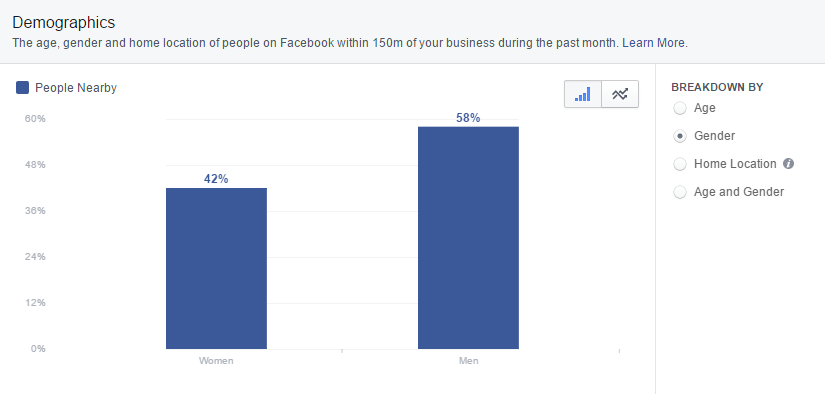
Demographics
Want to go beyond the limited Facebook analytics that Facebook Insights provides? Sign up for a trial of Unmetric and gather competitive intelligence and better insights.