
The Best of YouTube Analytics
Three hundred hours of videos are uploaded to YouTube every single minute, available to more than 1 billion people – one-third of all the internet users in the world. Videos that go viral on YouTube have the potential to reach more users across other social networks.
With major social media platforms like Facebook, Twitter and Instagram focussing on video-first strategy, the growth and explosion of video marketing is undebatable. It is easy to see why brands are investing in producing video content and advertising on YouTube like never before. Ultimately, as a marketer, you want to know how your efforts are translating to measurable results. Here’s where YouTube Analytics comes to the rescue.
The Best of YouTube Analytics
The main purpose of an YouTube Analytics tool is to measure how effective video marketing efforts are through traffic monitoring. In order to make the most of the platform, here are the metrics we think you should definitely keep track of for optimization.
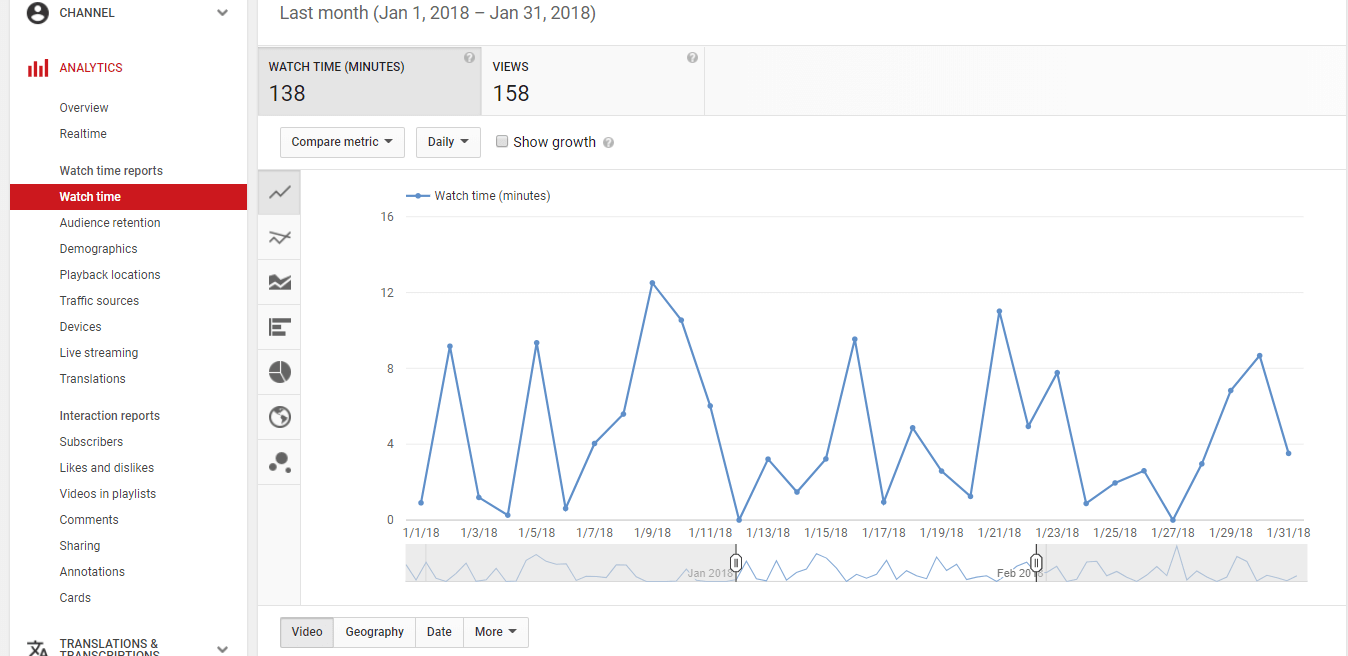
Watch Time
Watch time is the amount of time a user spends watching a video. This is one of the main ranking factors for YouTube videos. Watch time influences all major search and discovery algorithms on YouTube. This means that if your video has a high watch time, it’s likely to show up higher in search results and recommendations.
As time people spend watching your content goes up, so can brand awareness and favorability, purchase intent, and even sales. This is especially true for ads on YouTube.
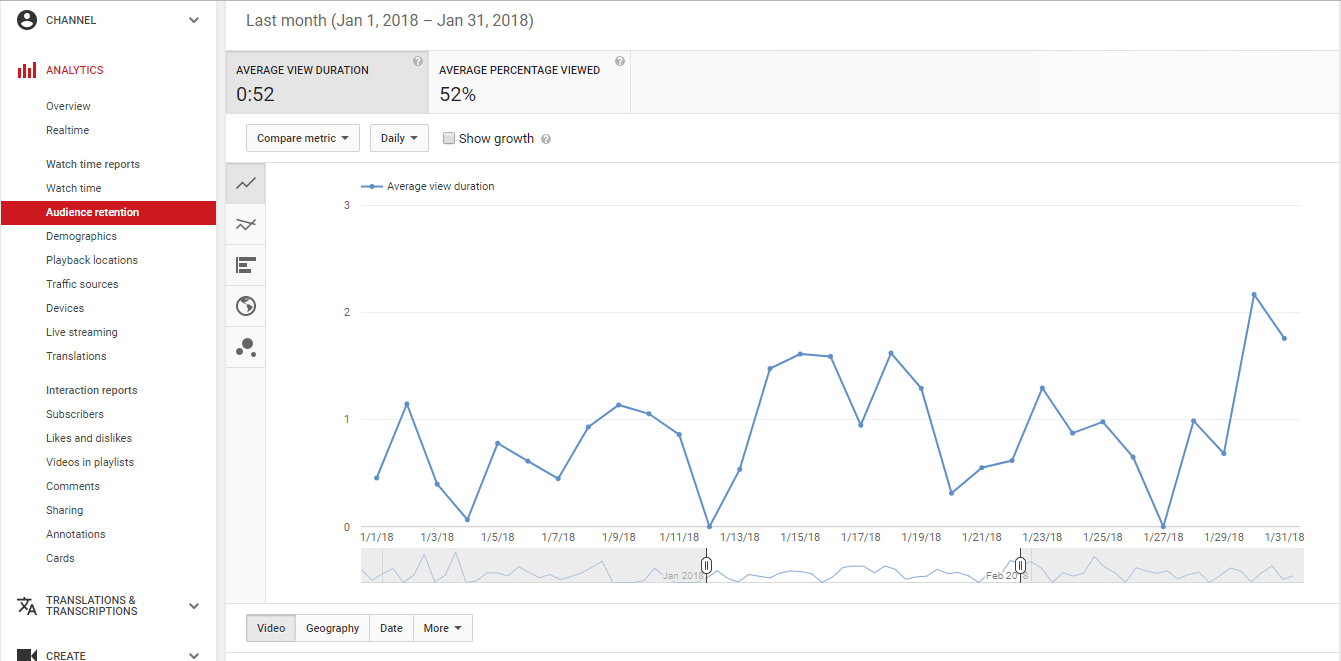
Audience Retention
As the name suggests, this metric measures just how good your videos are in retaining attention and ensuring that viewers watch your videos till the end. Relative audience retention shows how your videos keep the viewers attention in comparison to other YouTube videos of similar length.
By paying attention to the time frame when the audience quits your video, you can discover patterns of issues that can be addressed. This can help you with improving the content, regulating the video length or shaking up the entire format.
Demographics
This feature tells you who is consuming your videos, using dimensions like age, gender, geography, device, and more. This data can give you a better understanding of your target audience and whether you are effectively communicating with them.
Reviewing the demographics of your audience can offer new information to build your future videos and create content that appeals to your potential audience. The location of your potential customers could be of great value if you plan to reach out through targeted ads or content.
Third-party Analytics
You could ask why third- party analytics even exist when Youtube offers such extensive analytics. While YouTube Analytics provides a good start, this isn’t the only way you can evaluate your video marketing efforts. Third party companies offer a reliable and rich method for analyzing your YouTube viewership.
If you are a a global corporation or a small business, you stand to gain from competitive intelligence. YouTube analytics offered by third party companies, such as Unmetric, allow you to see where you rank vis-a-vis your competition. Unmetric provides data for over 100,000 brands helping you understand where a brand stands in relation to its industry and peers.
The insights you gain from competitive YouTube analytics can power key decisions that improve your social ROI. This way, you can optimize your social presence.
Competitive Intelligence in Action
To show you how Unmetric’s YouTube analytics solution works, we took a look at the the top five QSR brands in America during the period between 1st January 2018 to 28th February 2018.
Channel Views
The chart below shows the average channel views garnered by each of these brands:
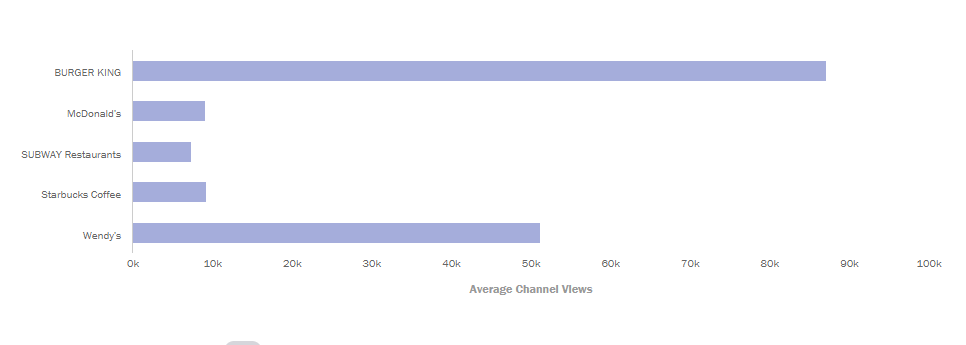
Burger King which uploaded 13 videos during the time period and registered the highest average channel views. McDonald’s and Wendy’s which uploaded 21 and 19 videos respectively, had low average channel views in comparison to Burger King.
Channel View Growth Rate
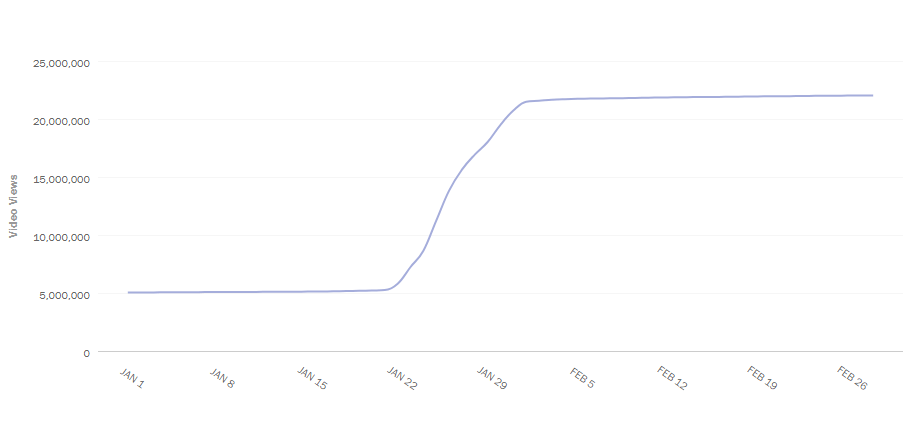
The chart above represents the channel view growth rate for Burger King. The fast food chain added more than 1.6 million views from January 21 to February 1. With a growth rate of 337%, the brand enjoyed the highest growth rate in total channel views among the 5 brands that we looked at.
Subscriber Growth Rate
Burger King also experienced a 22% growth in subscribers. While the average Restaurant & Cafe YouTube channels from North America added 557 subscribers in the period, Burger King added 12, 234 new subscribers. How did Burger King register such impressive growth rates?
Campaigns and Top Content
Burger King released a video campaign on its YouTube channel introducing its latest burger, from January 18th to January 22. In a move that many call a dig at McDonald’s, they rolled out a burger called Double Quarter Pound King, a knockoff of its rival McDonald’s Double Quarter Pounder. They released a total of 6 videos for the campaign, including two edgy ads referring to the end of an unnamed burger (read McDonald’s). These videos garnered over 12 million views. On January 24th, Burger King released an ad on Net Neutrality that caught many eyeballs. The video gained them more than 4.3 million views.
Likes, Dislikes and Comments
The chart below shows the likes, dislikes and comments for both Burger King and McDonald’s.
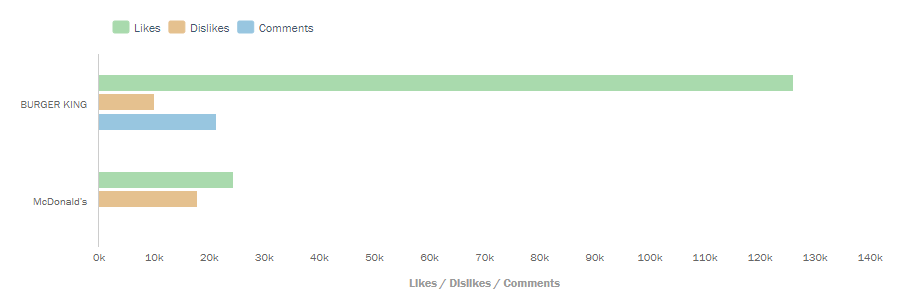
Not only did Burger King receive higher engagement for their videos, but they also received more positive sentiment. While McDonald’s with their high number of video dislikes, received more negative sentiment. But what purpose does all this information serve for another QSR brand?
Finding Actionable Insights from Competitive Intelligence
The fact that McDonald’s got more dislikes and negative sentiment essentially could mean two things – that their content is not working well or that they aren’t putting efforts into promoting their content. An unusual spike in video views for your competitor could indicate that the videos are being promoted and are hence reaching a wider audience. This means that your competition might be selling more to your ideal customers.
Competitor benchmarking can provide insights into what works with your audience and what doesn’t. It can tell you where your competitors are spending money. Is it that they are just boosting videos or are they posting more content?
As a brand you want to know if your social media content is performing well. Your performance reports in isolation don’t show the complete picture. Third party analytics tools like Unmetric will inform you if you’re performing as well as you potentially could or if your competitor is doing even better. Insights about your competitors can be translated into better marketing strategies and tactics.