
How to Use Twitter Analytics to Improve Your Social Strategy
If there’s one rule that applies to all things social media, it’s ‘measure, measure, measure’. To succeed on any social network, social media marketers have to be attentive to data. The insights gained need to go into refining their strategy. In this article we take a close look at Twitter analytics. We’ll discuss what this involves, what you stand to gain from it and ultimately, how you can use Twitter analytics to bolster your social media strategy.
What is Twitter Analytics
Twitter analytics essentially involves closely analyzing different metrics related to brands’ performance on the platform. This reveals patterns that can help explain why a particular type of tweet is more likely to succeed than others. With this knowledge brands can fine-tune their Twitter strategy to get the best results.
A lot of existing articles restrict the discussion on Twitter analytics to the insights that can be accessed on the native analytics solution. There’s a very simple reason why this is so – the native analytics solution powered by Twitter is called Twitter Analytics!
At Unmetric, we adopt a broader understanding of Twitter Analytics. This includes a comprehensive awareness of your immediate environment on Twitter in addition to a concrete evaluation of your owned efforts.
We help marketers improve their Twitter strategy by uncovering trends in engagement, timing, campaign performance, audience growth etc. In addition to concretely evaluating your owned efforts, we place it in the context of your industry, peer group and aspirational brands. This way you can understand why a competitor is getting more engagement. You can infuse this insight into your own social media strategy to stay ahead.
Where Do I Get All This Data?
Twitter’s in-house analytics platform provides you a very valuable set of metrics and insights. This includes:
Topline Metrics
The dashboard you see on your Twitter Analytics homepage is a quick overview of your topline metrics. If you want a quick update on how your tweets are engaging your audience, these metrics are what you need.
You get to see the number of tweets you’ve published, the impressions they’ve garnered, how many followers you have, how many people have viewed your profile and the number of times others mentioned you in their tweets. This is for a 28-day period and also shows how you’ve fared compared to the previous period.
Apart from that, marketers can catch a quick glimpse of their monthly performance. Within Twitter Analytics home, you get to see your top tweet and top mention for every month. You also get a summary of tweet volume, impressions, profile visits, mentions and follower growth. This can be incredibly useful to see how your performance matches up with previous months. Not to mention how convenient it is to have all this data in one place for a quarterly meeting.
Tweets
For a more detailed analysis of your activity on Twitter, you can head to the Tweets section. Here you can see a day-by-day breakdown of your performance. You can also view a list of all the tweets you’ve published in that time period and access engagement metrics for each tweet.
If you go to the Top Tweets tab here, you can easily promote some of your well-performing tweets so that they get more traction. You can assess how well your promoted tweets have performed in the Promoted tab.
Videos
Videos are becoming an essential component of every brand’s social media marketing playbook. Twitter has taken proactive steps to encourage the use of videos. This includes an in-built video creation tool, the Vine Camera App and detailed analytics on video content performance.
In addition to video views, Twitter Analytics also provides the completion rate of each video. This is a great way to evaluate how people are receiving your video content.
Brand Hub
Audience insights
Twitter analytics provides a detailed breakdown of your audience’s interests and demographics. This is extremely useful information that you can tap into to refine your messaging so that it is more relevant.
You get an overview of their top interests, demographics, lifestyle, consumer behaviour and mobile footprint. You’ll get to know that, for instance, your audience is interested in sports news, speaks English, buys premium products mostly online and uses AT&T connections. This reveals so much information that can help you with deciding when to tweet, what angle you should take etc.
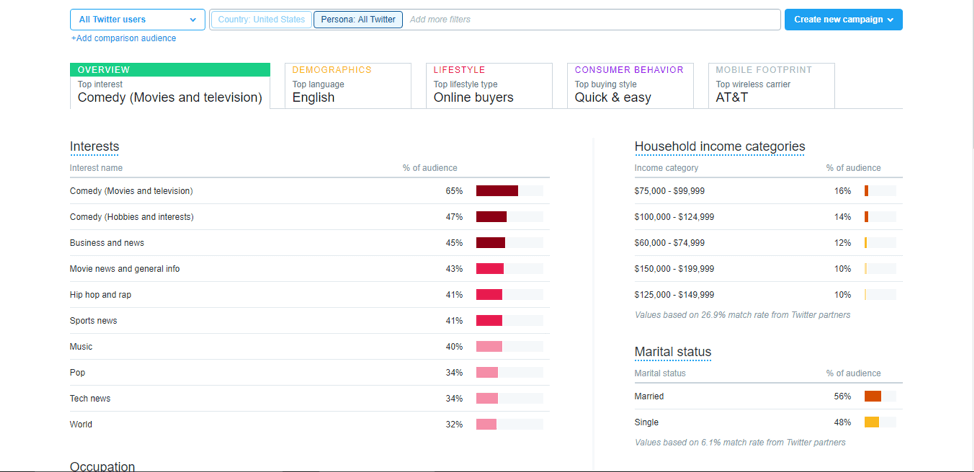
What’s even more impressive is that you get this information for different segments of your audience. You can see what the majority of the audience on Twitter is most likely to be interested in, as well as what your followers, organic audience, campaign audience and tailored audience might be.
Especially for tailored audiences, this is vital information. Tailored audiences are similar to custom audiences. This can be a list of people who’ve visited your website or used a certain part of your app. The aim of having such lists is so that you can give them the much needed push to proceed to the next stage of the funnel (signing up, filling a contact form or exploring the paid version of your freemium app). Using audience insights, you can up the relevance of your tweets and ensure that your ad spend gets the best results.
Events
Now that you’ve got a clear picture of what your audience is interested in, you need to be aware of upcoming events that are important to them. For example, if you know that your audience’s top interest is fashion, then you need to know when NYFW is and how long your campaign around that event should be.
Twitter Analytics makes this easy by providing an overview of all major upcoming events. If your audience is more interested in movie releases, you can even head to the movies tab to find a list of upcoming releases.
In addition, you can quickly chart out a campaign around a particular event with the ‘create campaign’ button. Further, you can get a more detailed look at the top tweets around the event from previous years, demographics of the people who engaged with it etc.
Apart from event or holiday-related marketing, it’s important that brands have a steady stream of tweets. To help with this, Twitter analytics has a list of recurring trends. This includes mostly hashtags that are used regularly all through the year such as #TBT, #WCW etc.
Events Pro – aka Unmetric Discover
While this is pretty awesome, at Unmetric we have something that we believe is even better. Marketers can stay on top of upcoming content opportunities and ideate using a searchable database of branded content. With Discover, you can identify events that are important in your industry or region and retrieve tweets around these from the previous year. These tweets are exclusively by brands. By using filters, you can restrict the results to specific industries, time periods and geographical locations. You can do the same for Facebook, Instagram and Pinterest too!
With this, you can find events and holidays that are relevant to your industry. The best part about bringing data in here is that you can gauge the returns you can get from participating in a particular conversation.
Can I Access Twitter Analytics for Another Account?
As we discussed, the data provided by Twitter Analytics is quite ample. However, marketers might often find that this data lacks context. Social media marketing is now severely competitive. You need to make sure that your brand puts up an outstanding performance on every count.
Unfortunately, you can’t access Twitter Analytics data for each of your competitors. However, you can use a competitive intelligence solution to see how your efforts stack up relative to the competition. It basically gives you most of the data that you get via Twitter Analytics, along with in-depth campaign intelligence and customer service benchmarks.
Our competitive intelligence solution, Unmetric Analyze, is powered by our AI, Xia. Xia gives you insights on how to elevate your social media performance by analyzing patterns in social data. She keeps a close watch on what your peer group is up to and will alert you about content opportunities you don’t want to miss out on.
Here’s a quick rundown of what you can gain from using Analyze:
Data on Your Competitor’s Performance
For any individual brand for a specified period, you can find:
- Followers – The number of people who follow a particular brand’s profile.
- Follower growth – The percentage increase in the number of followers over the chosen time period.
- Engagement – The likes, replies and retweets received by a brand.
- Brand mentions – The number of times a brand handle has been mentioned by other brands or users.
- Customer service – The time taken by a brand to reply to a user tweet (ART), the percentage of user tweets a brand has replied to (Response Rate), the type of response they were most likely to send and the sentiment of user tweets they received.
- Hashtags – The different hashtags that are used by a brand, the number of times they’ve used them and the engagement they received.
- Timing – The time of the day and the day of the week that saw the best results for a particular brand.
- Campaigns – The different campaigns run by a brand, the number of tweets that were part of each campaign, engagement metrics and tweet types.
- Influencers – A list of the most influential Twitter users within an industry that the brand needs to have on their radar. You can also see the number of times they’ve mentioned or retweeted a particular brand.
- Word Cloud – Uncover a brand’s content strategy with this word cloud of the most commonly used keywords and their engagement.
- Retweets – Find out who a brand is retweeting. This way you can find out what sort of conversations they get involved in.
Comparison and Benchmarks
You can compare how a chosen list of brands (including your own brand) performed in terms of:
- Audience size
- Follower growth rate
- Engagement
- Mentions
- Hashtags
- Campaigns
- Customer service
In addition to these, you can also find:
Share of Voice – The number of tweets published by each brand. You can see a list of all the tweets published by your chosen set of brands. Search here to find the number of tweets each brand has put out around a particular topic.
What are the Benefits of Using Twitter Analytics?
Listed this way, these metrics do not make a lot of sense. Twitter analytics is all about analyzing these different data points, identifying the causal link between one metric and others and using the insight gained this way to bolster your social media strategy.
To show how this works in practice, let’s discuss a couple of examples of how Twitter analytics works in practice. The first one is about what insights you can learn from follower stats and how you can use that to improve your performance. The second example is from the aviation industry and involves providing the best social customer service.
What Follower Stats Can I Get and How Can I Use It?
Your owned analytics will show you how many followers your brand has, the number of new followers you’ve added in a certain period, and a demographic & interests-based breakdown. On Analyze, you can compare your growth vis-a-vis your peers.
Several brands prioritize growing their follower base in order to get some decent reach. The chart below shows the number of new followers added by 4 top auto brands.
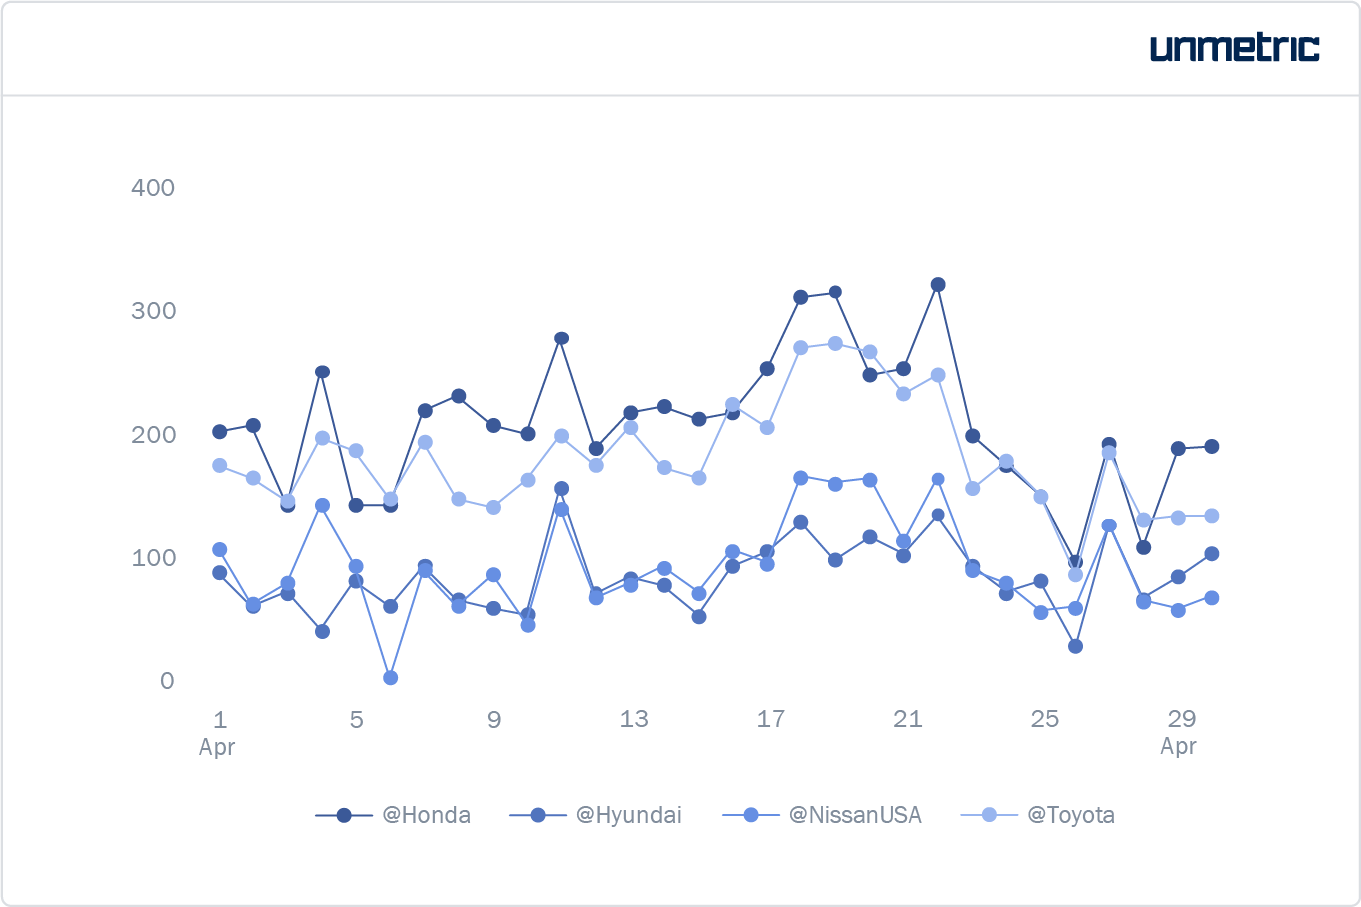
As you can see, Honda took the lead in adding new followers. This information on its own might not be very useful for their peers. At a marketing catch-up, the social media manager at Hyundai might have to explain why they are lagging behind in adding new followers.
Therefore, they need to discover the story behind Honda’s growing audience size. If you take a look at the follower growth for Honda alone, you’ll see that there’s a concentration in follower growth after April 17th, till the 23rd.
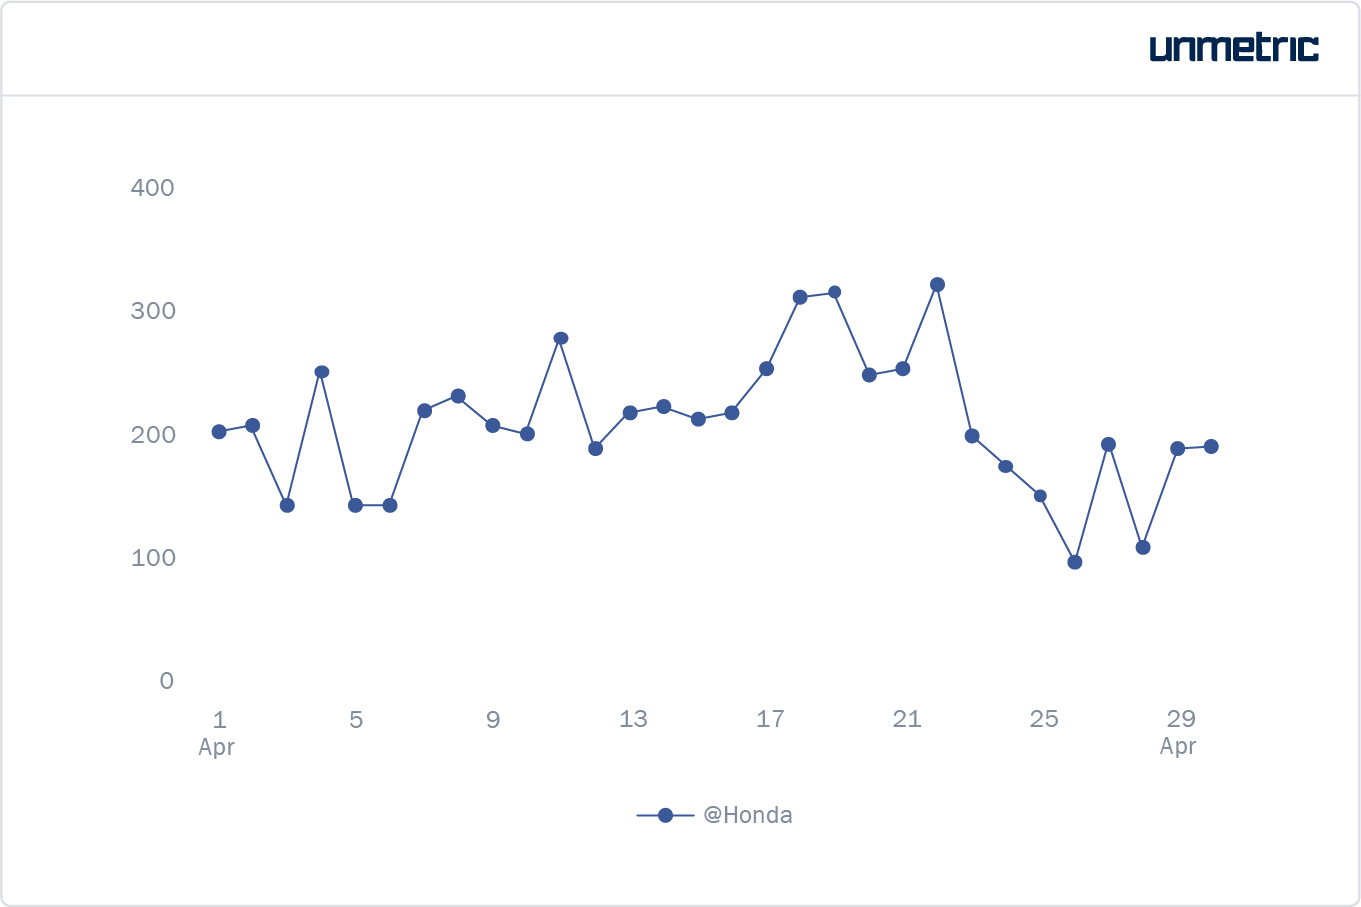
A quick look at their tweets during this period will reveal that Honda had a lot of tweets around their new cars. On 17th, they tweeted about their new hybrid car – Honda Clarity Plug-in Hybrid:
A plug-in hybrid vehicle that fits your passengers and all of their stuff comfortably? Meet the Honda Clarity Plug-In Hybrid.pic.twitter.com/iaXfpr7Cft
— Honda (@Honda)April 17, 2018
They followed this up with a design sneak peek of the 2019 Honda Insight and more details about Clarity. This led up to one of their most engaging tweets in April about the latest Honda Accord:
There’s nothing average about the sleek 2018 #HondaAccord, the most impressive Honda yet. pic.twitter.com/kp9uYtOn52
— Honda (@Honda) April 22, 2018
The auto brand had already been running ads around ‘Honda Dream Garage Spring Event’ which promised great deals on the Accord:
The Honda Dream Garage Sprint Event ends April 29, so hurry in to get a great offer on a stylish Accord!
— Honda (@Honda) April 11, 2018
So a strong social budget might have also played a part in getting the profile more eyeballs and consequently more followers. This can make your case for a bigger budget and/or explain why your competitor is getting better results.
What Customer Service Benchmarks Should I Set for My Brand?
Here’s an example from the Aviation industry. Most airlines are very particular about replying to customer queries on social media promptly. For this reason, customer service benchmarks are extremely important to them.
So, if I manage or oversee social media for Delta, I need to know how we’re doing on customer service. I’ll pull up the customer service data for the previous month (April 2018) for Delta and four of our competitors.
The first chart I look at to get a quick summary is this scatter plot of how quickly these brands responded and to what percentage of users:
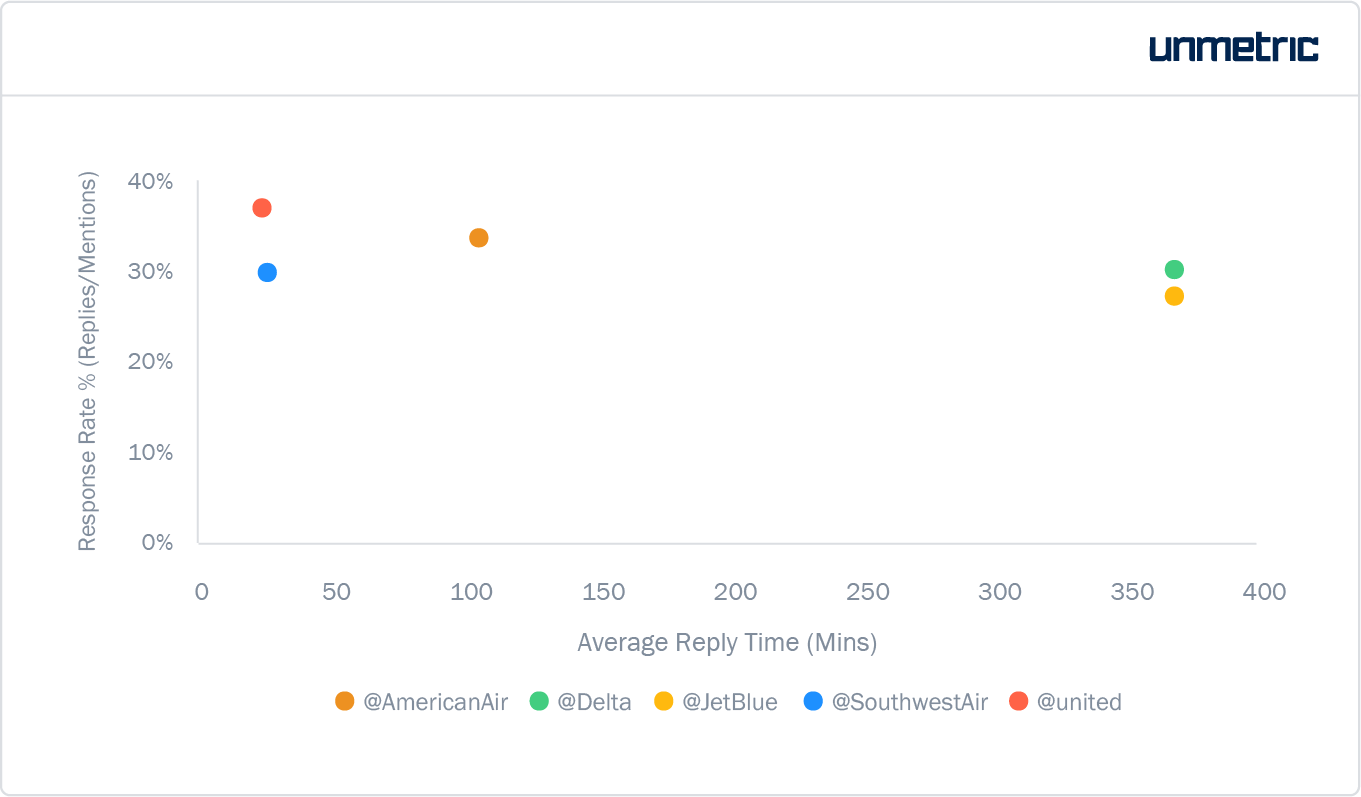
United and Southwest have set the bar for customer service very high. Delta’s social media customer service falls short when it comes to prompt responses. To get a more concrete picture of where I should improve I’d like a closer look at the average response time.
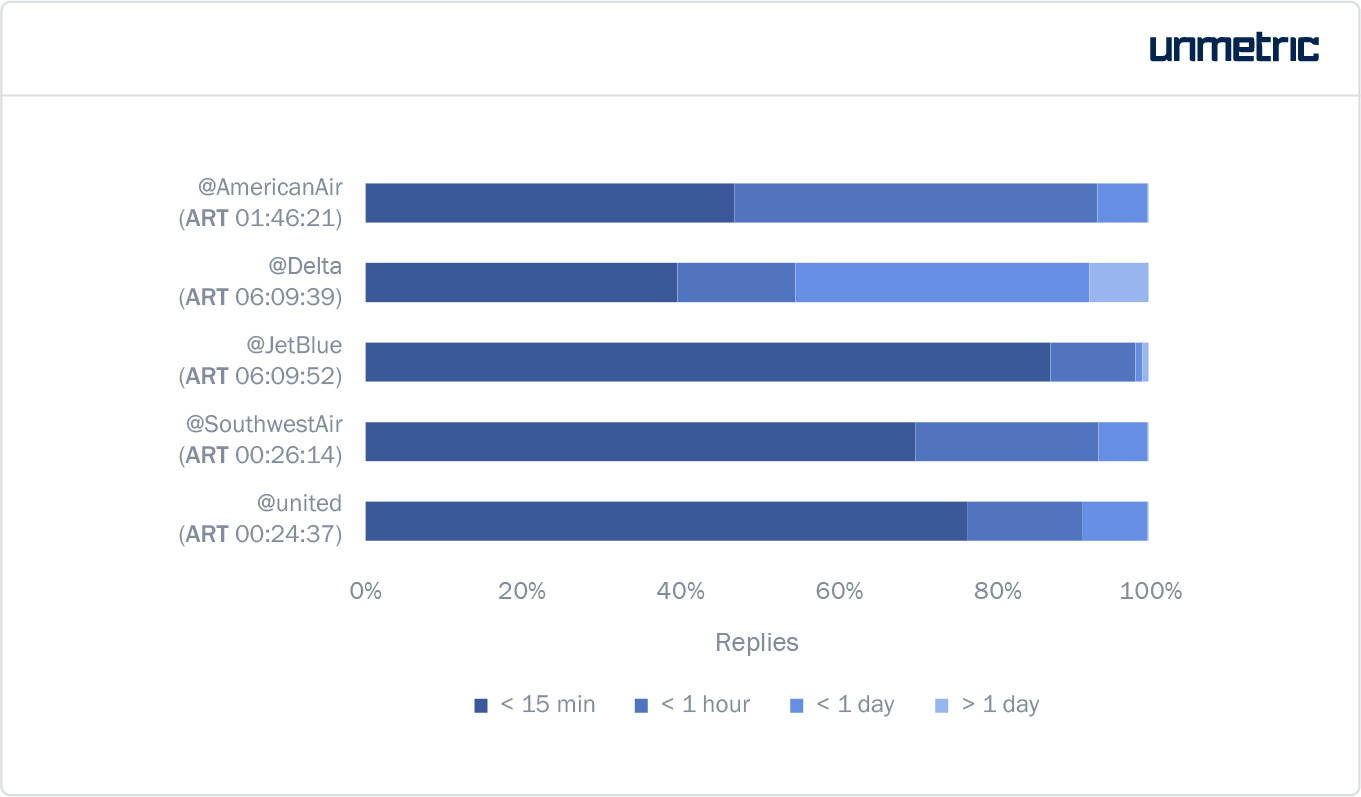
In the following chart, I can see the percentage of tweets that have been responded to within 15 minutes. Almost 80% of United’s replies have been within 15 minutes! Delta could do that only for half as many replies. So I can maybe pull in some extra hands to make sure that more of our user tweets gets replied to within 15 minutes.
I can dig even further into United’s customer service playbook by checking out how they actually responded to customer queries.
This is great to hear, Bruce! We’re so glad that you enjoyed your visit to the United Club. ^EM
— United Airlines (@united) April 1, 2018
Hey Leonel, I’m sorry to hear your bag is delayed. Please DM the file reference number so we can get an update for you. ^JB https://t.co/Y6hG6uklaR
— United Airlines (@united) April 1, 2018
For a brand that replied to over 12,000 user tweets in April, they reply promptly and without resorting to cold, templatized replies. In the above examples, the first tweet was replied to in about 3 and a half minutes and the second in just over 6 minutes. From these, it’s clear to me that my customer service in-charge shouldn’t compromise on providing customized, relevant and attentive responses when improving their response time.
From these examples, there’s a strong case to use Twitter analytics to plan and execute an effective strategy on the platform. Using Twitter analytics, you can:
- Know your audience better and provide an optimum social media experience for them
- Plan your content better so that they yield the best results
- Better evaluate your owned efforts on Twitter, what you’ve spent vis-a-vis results
- Unpack the social media strategy of peers and industry leaders and identify your own potential for improvement